
Entries from August 1, 2019 - August 31, 2019
UK data wrap: more recessionary indications
 Simon Ward
 Post a Comment
UK economic news remains consistent with a recession having started in Q2.
The CBI’s expected growth indicator – a GDP-weighted average of future output or sales responses from its monthly surveys of manufacturing, distribution and other service industries – is estimated to have plunged into contraction territory in August; the CBI will release the August result over the weekend – see first chart.

An early recession warning was a contraction of real M1 holdings of private non-financial corporations (PNFCs) in the six months to February, signalling likely business retrenchment. July monetary data released today show that the six-month change remained negative last month – second chart.

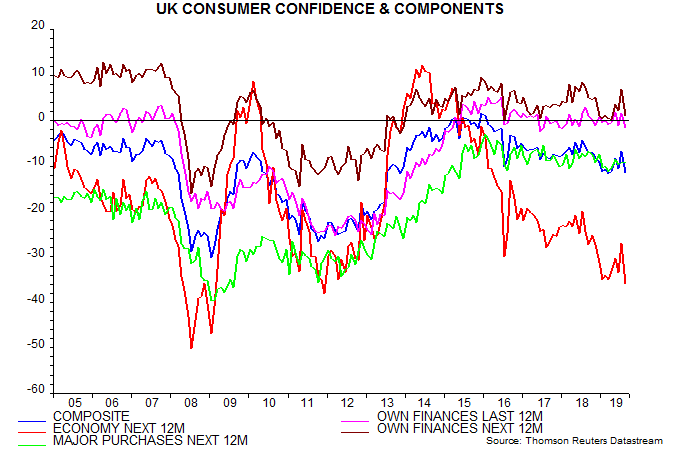
Household real M1 holdings are still growing but have slowed, with further weakness likely as a softer labour market curbs income growth. Households were markedly more pessimistic about recent and prospective trends in their finances in the August GfK / EU Commission consumer survey, contributing to a large drop in the composite confidence index – third chart.
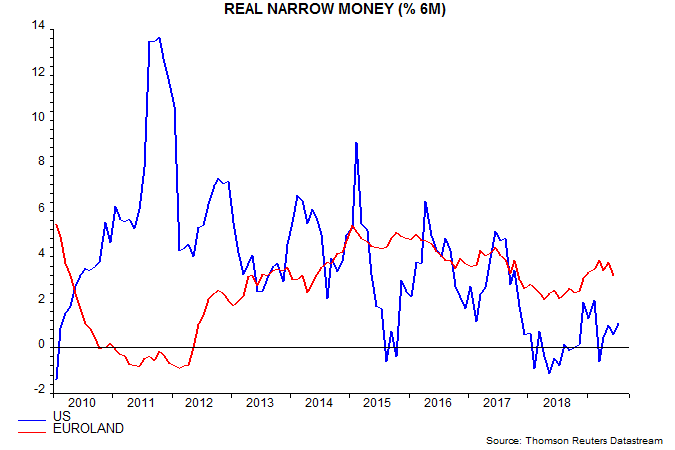
Euroland money trends suggesting 2020 recovery
Euroland money measures grew strongly in July, more than compensating for softer June data and suggesting improving economic prospects.
Previous posts argued that economic momentum would bottom around Q3 and recover into 2020, based on a strong rise in six-month real narrow money growth between November 2018 and March 2019. The monetary pick-up stalled in Q2 but is now back on track, while the manufacturing PMI appears to be stabilising on schedule – see first chart.

Six-month growth of nominal narrow money rose to a 25-month high in July – second chart. The Q2 pull-back in real money expansion reflected a rise in six-month consumer price inflation but this is probably peaking.

Narrow money acceleration is being driven by plunging bond yields, which have moved to discount a major ECB easing package next month. Euroland monetary and economic trends are sensitive to changes in longer-term yields – third chart.

A country breakdown is available for the deposit component of narrow money. Growth is solid across the big four but has cooled recently in Spain while strengthening in Italy – fourth chart.

While monetary trends are hopeful, the economic outlook remains at risk from hostile external policies – a no-deal Brexit and / or US imposition of auto tariffs.
Industrial output has fallen by more in Germany than other Euroland economies, partly reflecting greater sensitivity to Chinese / global trends, but a bounce-back could be imminent. Recent woes were signalled by the six-month change in real M1 deposits of non-financial corporations turning negative in late 2018 but the latter weakness has now reversed – fifth chart.

The August Ifo manufacturing survey, meanwhile, contained glimmers of hope, with the orders inflow balance improving and the finished goods stocks balance consistent with a bottom in the inventory cycle – sixth chart.

Global economic weakness due to monetary policy not trade wars
The preferred narrative of central bankers and mainstream economists is that current global economic weakness primarily reflects US-driven trade policy conflict, which has depressed business confidence and derailed expansion plans. This narrative is false.
The loss of economic momentum started in H1 2018 and followed a collapse in global six-month real narrow money expansion during H2 2017. This collapse was caused by Chinese and US monetary policy tightening: the Fed had raised rates by 100 bp by June 2017, while the PBoC’s liquidity squeeze on shadow banking had inverted the Chinese government yield curve (i.e. 10-year versus 2-year).
The Trump administration began to impose tariffs only after the monetary shock, with the increase in coverage from $50 billion to $250 billion of Chinese imports proposed in H2 2018, by which time the global economy was already slowing sharply – see chart.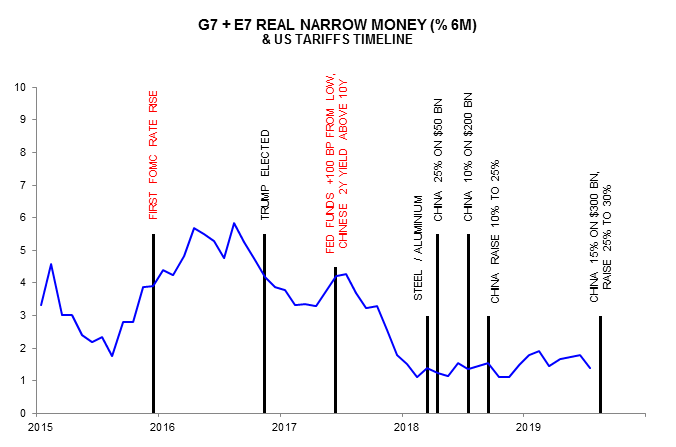
The trade conflict may have contributed to monetary weakness more recently, by suppressing spending plans and associated money demand. A more likely explanation, however, for money growth remaining low is the lagged impact of the further – and excessive – rise in US rates during H2 2017 and 2018.
Other central banks followed the Fed’s mistake of raising rates into monetary weakness, with the UK MPC an egregious offender.
The trade conflict provides a convenient excuse for such actors, enabling them to deflect blame for their policy errors. Mainstream economists are in collusion because of their own failure to forecast economic weakness.
Monetary policies are now easing but moves to date may be insufficient to offset previous excessive tightening and negative trade policy effects. This is suggested by weak July money numbers: as previously discussed, global real narrow money growth appears to have fallen sharply – additional July data this week will provide clarification.
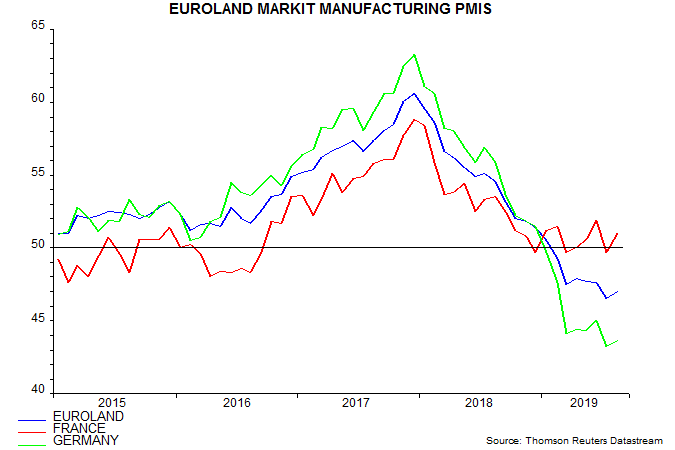
August PMIs: US / Euroland convergence
Narrow money trends have been signalling US economic weakness but a stabilisation of momentum in Euroland, with no recession – see, for example, here. August flash PMI results are consistent with this scenario.
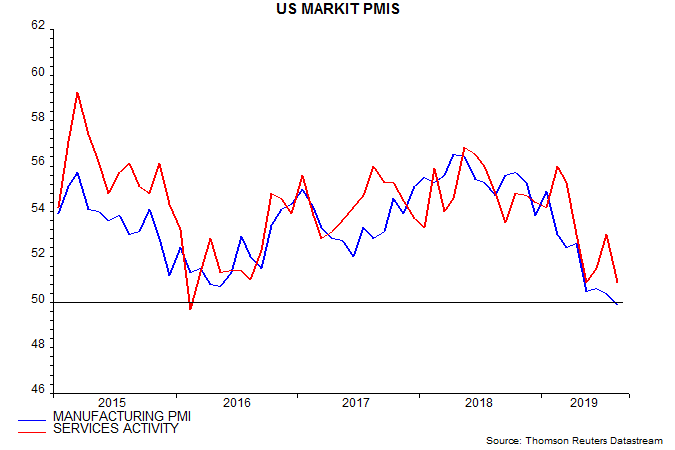
The US composite output index fell sharply in August, returning to its May low. The Euroland index bottomed in January and edged higher in August, moving back above the US level – see first chart.

The US output fall was driven by services activity but the manufacturing PMI slipped below 50, with the new orders component at a 10-year low – second chart.
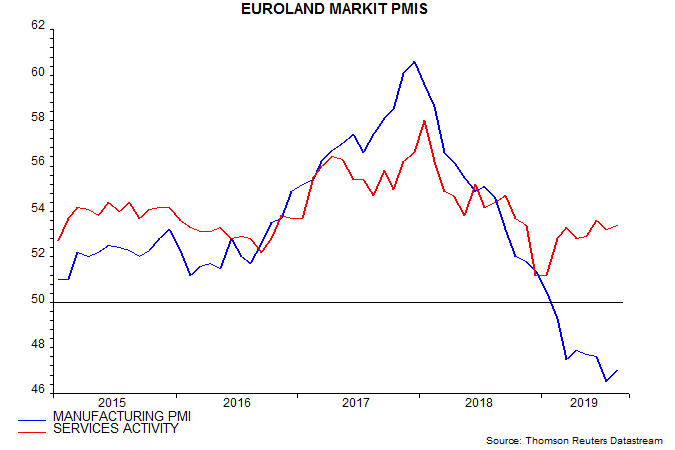
The Euroland manufacturing PMI remains much weaker but edged up in August; services activity, meanwhile, is stronger than in the US – third chart. Manufacturing woes continue to be focused on Germany, reflecting the economy’s sensitivity to negative trends in the auto sector, global capex and China. The French manufacturing PMI is the strongest among the G7 – fourth chart.
US six-month real narrow money growth edged up in July but remains well below the latest Euroland reading, for June – fifth chart. Euroland growth, however, has cooled recently and a further decline in July data released next week would question the scenario of economic stabilisation.
Why the US yield curve recession signal could prove misleading
Investors were spooked last week by a further inversion of the US Treasury yield curve but the manner of the inversion casts doubt on the validity of the associated recession warning.
Monetary trends are judged here to be a better guide to economic prospects than yield curve movements but the US curve has an impressive record of predicting recessions since the mid 1950s.
The headline development last week was a fall in the 10-year Treasury yield below the 2-year yield, although the cross-over subsequently reversed.
The 10-year / 2-year spread is the favoured curve measure of many market analysts but the 10-year / 1-year spread has a slightly superior historical forecasting record. The latter turned negative ahead of all 9 recessions since the mid 1950s, with only one false signal, in 1965-67 – see first chart. The 10-year / 2-year spread gave an additional false signal in 1998.
Source: Federal Reserve, NBER
The 10-year / 1-year spread turned negative in early August (it had done so briefly in March and May) and the inversion has persisted.
The recent inversion, however, is unusual because it has been driven solely by a decline in longer-term yields.
The second chart separates the 10-year / 1-year spread data according to whether the 1-year yield was higher (red) or lower (green) than 3 months before. All previous inversions, including the false signal in 1965-67, involved a rise in the 1-year yield in addition to or instead of a fall in the 10-year yield.
Source: Federal Reserve, NBER
This distinction suggests a higher risk that the current signal will prove to be false, unless the 1-year yield rises and the curve remains inverted.
Narrow money trends, while continuing to signal weak economic prospects, are not obviously recessionary. The third chart shows the behaviour of real (i.e. CPI-deflated) narrow money before and after the start of the last 9 recessions (red lines) and the 1966-67 slowdown associated with the false yield curve signal (green line). Real narrow money contracted in the 12 months preceding the recession / slowdown start dates but has risen over the past 12 months (blue line).
Source: Federal Reserve, BLS, NBER
Global money trends still downbeat
Incoming narrow money data for July have been disappointing, suggesting that a global economic recovery will be delayed until Q2 2020.
The US, China, Japan, India and Brazil have released July monetary data, together accounting for two-thirds of the global (i.e. G7 plus E7) aggregate tracked here. Incorporating near-complete CPI data, six-month growth of global real narrow money is estimated to have fallen from 1.8% in June to 1.4%, the weakest since March – see first chart.

The July estimate is only slightly above a low of 1.1% reached in October / November 2018. Allowing for an average nine-month lead, the suggestion is that global six-month industrial output momentum will bottom in the current quarter but then bounce around at a weak level through April 2020.
The July reading is far below the 3% level judged here to be necessary to signal an economic recovery, in the sense of a return to trend growth or higher.
The July setback reflected a sharp fall in Chinese real narrow money growth, discussed in a post last week – second chart. Japanese and Brazilian readings were also softer, while US real money growth edged up but remains weak. The July outturn will depend importantly on Euroland and UK data released on 28 / 29 August.

