
Entries from August 1, 2019 - August 31, 2019
Labour market watch: gathering UK weakness
 Simon Ward
 Post a Comment
According to Gluskin Sheff economist David Rosenberg, recessions in the US “historically begin when the unemployment rate climbs 0.4 percentage points above its cycle low”. The UK single-month unemployment rate rose from a low of 3.7% in May to 4.1% in June, raising a recession warning flag.
The UK single-month rate is based on a small sample and is much more volatile than its US counterpart. A monthly rise of this size, however, is unusual: excluding the 2008-09 recession, an increase of 0.4 pp or more occurred in only 4% of months between July 1992 (the earliest available data point) and May 2019.
The ONS surveys largely the same group of individuals every three months, suggesting focusing on the three-month change in the single-month unemployment rate rather than the month-on-month change. The three-month increase was 0.3pp in June, the highest since 2015.
The suggestion of a trend reversal in unemployment is supported by an ongoing decline in the stock of job vacancies, which were down by 4.8% in July from six months earlier (three-month moving average). The six-month change is the most negative since the double-dip recession scare of 2011-12 – see first chart.

Other recent labour market developments have a recessionary flavour, including a fall in the employment shares of full-time workers and employees, a stagnation in total hours worked and a faster drop in temporary working. Part-time employees and the “self-employed” account for all of the rise in total employment over the last six months.
The consensus has played down the 0.2% Q2 GDP fall as payback for Q1 strength due to Brexit stockpiling. Two-quarter growth, however, declined to 0.3%, a post-GFC low, and corporate money trends are signalling a further slide to zero or negative during H2 – second chart. A recession remains the baseline scenario here regardless of Brexit developments.

Chinese policy easing still isn't working
Chinese July money numbers were very disappointing, signalling that an economic recovery remains distant. More decisive monetary policy easing is urgently required but the authorities are constrained by a teetering RMB and surging food prices.
Six-month growth of narrow money dropped sharply in July, reversing a four-month improvement – see first chart. Broad money growth (not shown) was similarly weak. Broad credit expansion registered a smaller decline but had recovered by less previously.
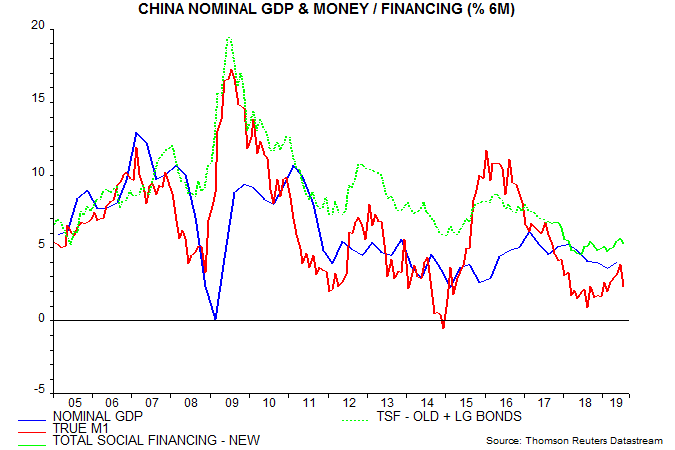
Money / credit growth in real terms – i.e. relative to consumer prices – was additionally depressed by a rise in six-month inflation to an eight-year high, reflecting strong food prices, which were up by 9.1% in July from a year earlier. Real narrow money growth dropped back to near its late 2018 low – second chart.

Money / credit trends are weak mainly because a policy-driven fall in money market rates has not been transmitted to the wider economy. Average interest rates on banks’ enterprise loans and mortgages remained elevated in Q2, according to the PBoC’s just-released monetary policy report – third chart.
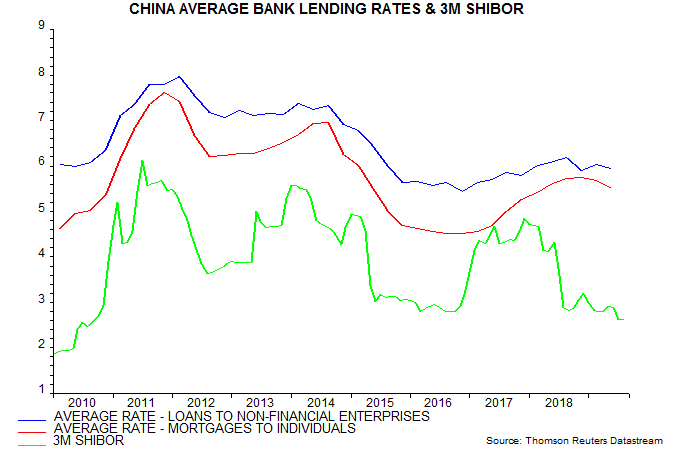
The limited pass-through may partly reflect official guidance to banks to avoid another lending splurge. In addition, the failure of Baoshang Bank in May resulted in a rise in funding costs for smaller institutions.
The authorities are relying on fiscal stimulus to boost the economy but may be forced to reopen the credit sluice gates. Such action, however, risks cratering the currency. As well as falling through 7 against the US dollar, the RMB has now breached 2017-18 lows against the official currency basket – fourth chart.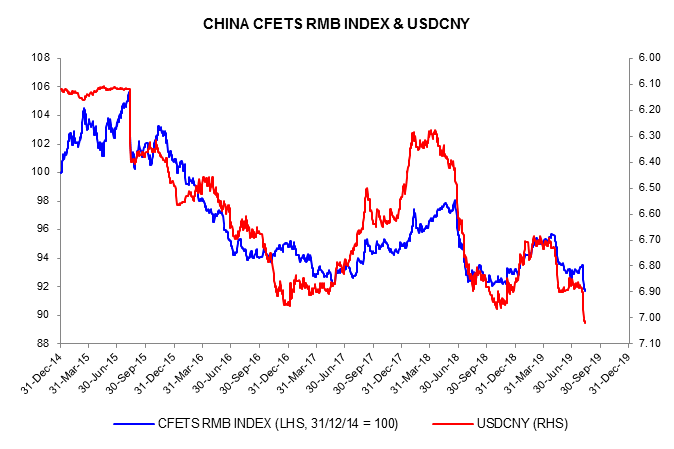
Don't discount a 2020 rebound
The immediate global economic outlook remains weak but cycle analysis suggests that 2020 will be a recovery year.
Growth, indeed, could be strong in H2 2020. The stockbuilding and business investment cycles are expected to bottom by Q2 2020 at the latest, while the upswing in the longer-term housing cycle should regain momentum in response to current falls in mortgage rates and as the drag from the other cycles is lifted.
This optimistic scenario requires confirmation from a rise in global six-month real narrow money growth – currently still below 2% – to well above the 3% level judged here to be a necessary condition for an economic recovery. This could occur in late 2019 or early next year.
The suggestion that US housing will be a source of economic strength next year is supported by the latest Fed senior loan officer survey, showing the net percentage of respondents reporting stronger mortgage demand surging to a 16-year high – see chart*. The survey was conducted in July before the recent further fall in Treasury yields, which has yet to feed through to mortgage rates.

Economists were too optimistic about 2019 global economic prospects but many are now warning of a recession in 2020-21. Monetary and cycle analysis, by contrast, indicates that economic weakness will reach a maximum during H2 2019. Assuming that monetary trends continue to improve, investors could consider using “risk-off” market moves to reduce defensive positioning and increase exposure to 2020 recovery plays.
*The series shown is a simple average across loan categories.
Global economic update: stabilisation but no recovery
The long-standing forecast here has been that global industrial momentum would reach a low around Q3 2019. The latest business surveys are consistent with this forecast.
The global manufacturing PMI new orders index edged up in July, while the difference between the orders index and an average of inventory indices for inputs and finished goods – a leading indicator – rose to a five-month high.

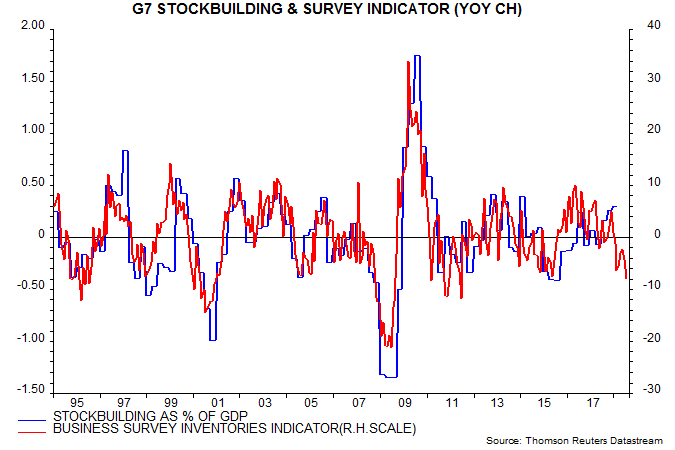
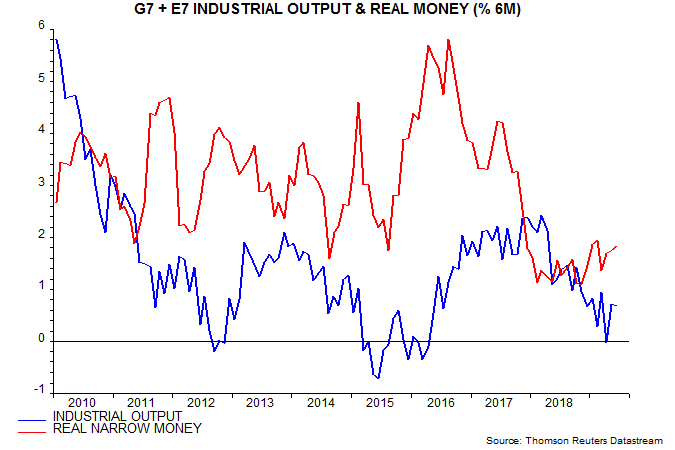
The suggestion that the negative impact of the stockbuilding or inventory cycle is peaking is supported by national business surveys. The second chart shows the contribution of stockbuilding to G7 annual GDP growth along with a proxy indicator derived from national surveys (ISM, Ifo, Insee etc). The contribution was still significantly positive in Q1 but the indicator points to a large drag in Q3 / Q4. Its current level is consistent with the stockbuilding cycle moving into a low.
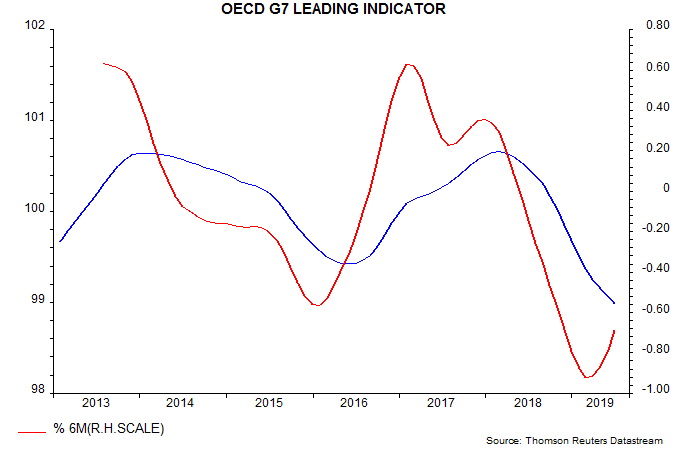
The business surveys feed into the OECD’s widely-watched leading indicators. The OECD will release June indicator data (incorporating the July survey results) on 8 August. With most of the component information available, an independent calculation is possible. The G7 leading indicator is estimated to have fallen further in June but the pace of decline continues to slow – third chart. The six-month change bottomed in February, consistent with a low in six-month industrial output momentum in Q3, based on an average five-month historical lead
The above observations are not intended to suggest that an economic turnaround is imminent. Near-complete June monetary data confirm an earlier estimate that global six-month real narrow money growth remained beneath its recent February high of 1.9%, at 1.8% – fourth chart. The judgement here remains that a rise to 3% is needed to signal an economic recovery. The current message is that economic weakness will persist through Q1 2020, at least. A fall below the November 2018 low of 1.1%, of course, would negate the view that economic momentum is in the process of bottoming.
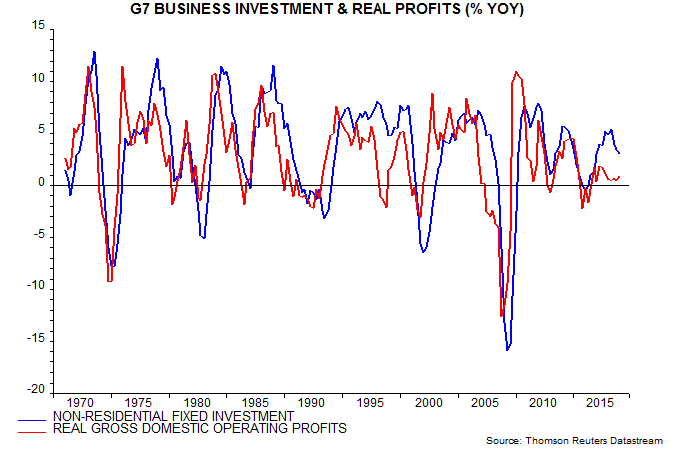
An additional reason for caution is that the business investment cycle appears further from troughing than the stockbuilding cycle. The annual rate of change of G7 business investment, while falling, was still significantly positive in Q1, with sluggish profits suggesting weakness – fifth chart. The investment downswing may not bottom until Q4 or Q1 2020, by which time the annual change is likely to be negative.
The suggestion of further investment weakness is supported by the sectoral breakdown of the global manufacturing PMI new orders index, with the investment goods component falling to a new low in July – sixth chart.
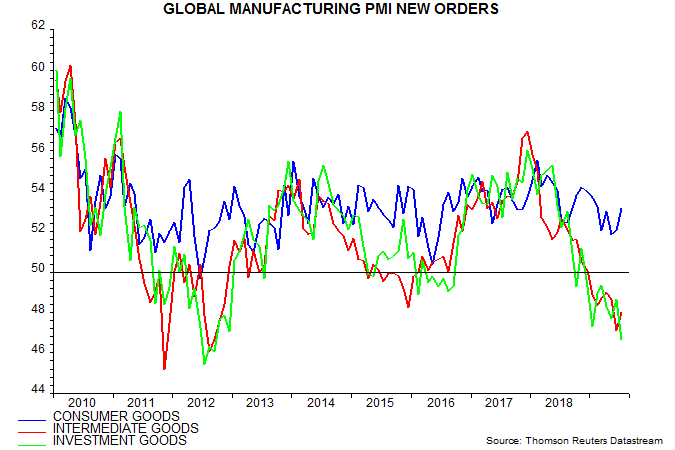
The resilience of consumer goods orders accords with the cycle analysis, which interprets current economic weakness as producer-driven – i.e. due to the stockbuilding and business investment cycles. Consumer-led downturns are driven by housing busts but the housing cycle remains in a longer-term upswing. Consumption momentum, nevertheless, is expected to fade over coming quarters as unemployment moves higher.
