Entries from September 1, 2017 - September 30, 2017
UK data arguing for early rate rise
UK consumer price inflation rebounded to 2.9% (2.86% before rounding) in August and is on course to exceed the August Inflation Report projections of 2.68% and 2.75% for the third and fourth quarters respectively. With activity data and surveys indicating that GDP growth is holding up in the third quarter, and the labour market tightening further, the case for reversing the August 2016 Bank rate cut has strengthened.
A post in July argued that a pull-back in CPI inflation from 2.9% in May to 2.6% in June represented temporary relief and that both headline and core rates would reach higher levels later in 2017. While August headline inflation was on a par with May, the core rate – i.e. excluding energy, food, alcohol and tobacco – moved up to 2.7% (2.66% before rounding). Core inflation is the highest since 2011, or 2009 excluding the impact of VAT changes.
The August increase partly reflected a sharp rise in annual clothing inflation, which may partially reverse in September – prices rose relatively strongly in September 2016. The contribution of electricity and gas prices, however, will increase, with British Gas raising its standard electricity tariff by 12.5% on 15 September. A surprise fall in food inflation, meanwhile, may be reversed: CPI food inflation of 2.3% in August is unusually low relative to producer output price inflation for food products of 5.9%. A rise in the maximum undergraduate tuition fee to £9,250 may exert a small upward influence from October.
The expectation here is that headline inflation will average 2.9% over the remainder of 2017, with a 3.0% reading likely in at least one month.
Output and turnover data released last week suggest that July GDP was 0.3% above the second quarter level, i.e. third-quarter growth is on track to match or exceed the 0.3% projection in the August Inflation Report. The single-month unemployment rate fell to 4.2% in June, below the Report's 4.4% forecast for the second half. Staff placements are rising strongly while candidate availability has declined further and starting salaries for permanent jobs are increasing at their fastest rate since 2015, according to the latest Recruitment and Employment Confederation survey.
Cell phone effect cuts US inflation, boosts growth
A significant portion of the recent fall in US core inflation is attributable to a quality adjustment to cellular phone charges to reflect plans allowing unlimited data usage. This statistical effect should – and probably will – be ignored by the Fed in deciding how fast to “normalise” monetary policy.
The Fed’s preferred core inflation measure – the annual increase in the personal consumption expenditure price index excluding food and energy – fell further to 1.41% in July compared with a recent peak of 1.91% in October 2016. Three-tenths of the reduction over this period is attributable to a much faster rate of decline of cell phone charges. A modified core measure excluding cell phone services fell from 1.98% to 1.63% between October and July – see chart.
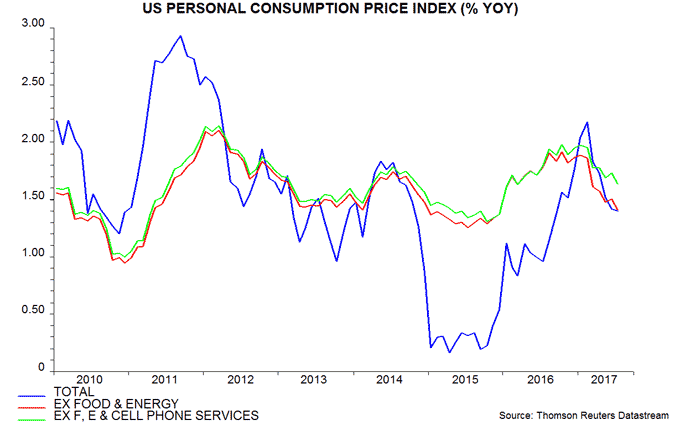
Cell phone users aren’t spending any less: aggregate outlays on cell phone services actually grew by 1.1% in the year to July. Official statisticians, however, reckon that consumers are getting much better value for money, mainly reflecting the shift to unlimited data plans, so their estimate of the price per unit of services has fallen by 13.3% over the past 12 months.
By extension, the volume of services consumed, according to the statisticians, has surged by 16.5% over the past year, contributing 0.21 percentage points to overall personal consumption growth of 2.72%.
This statistical procedure may or may not be justified but the negative impact on inflation should be ignored by the Fed, because the shift to unlimited data plans is a unique event and has no relevance for assessing whether monetary conditions are appropriate to achieve the 2% inflation target over the medium term.
Core inflation excluding cell phone services of 1.63% in July is below a 2016 average of 1.80% but up from 1.39% in 2015. The Fed must balance the current undershoot against a rising pressure of demand on available supply capacity, suggesting a future inflation increase. Economic strength in late 2017 / early 2018 is expected here to shift the Fed’s concern towards the latter, even if core inflation remains at its current level.
Global money trends still positive
Monetary data released this week confirm that global six-month real narrow money growth – the key forecasting indicator employed here – stabilised in July, after picking up over March-June*. Real broad money growth has also strengthened since early 2017 – see first chart. Monetary trends, therefore, are signalling a solid global economy in early 2018.
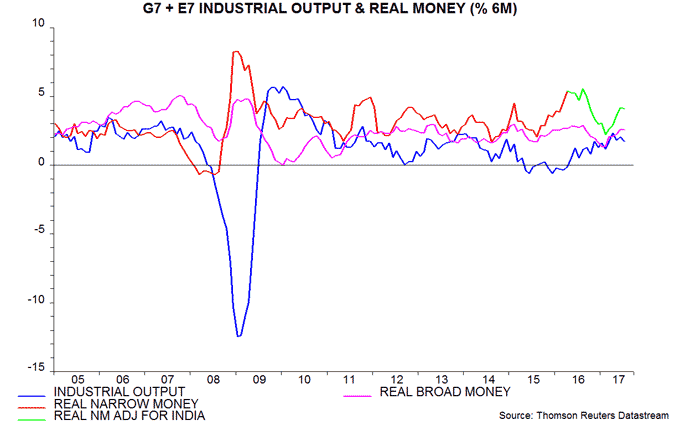
Six-month industrial output growth appears to have peaked in April, with available data suggesting a decline in July. The modest cooling since the spring is consistent with a decline in real narrow money growth in late 2016 / early 2017. The slowdown is expected here to extend slightly further before reversing in late 2017.
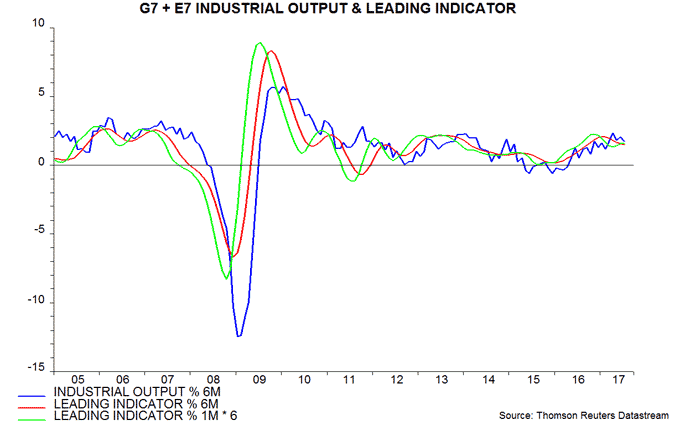
Such a scenario is supported by a shorter-term leading indicator derived from the OECD’s country leading indicators. Six-month growth of this indicator eased slightly further in July but one-month growth firmed for a third month, i.e. the indicator is close to confirming the monetary signal of a stronger economy from late 2017 – second chart.
The stability of global real narrow money growth in July conceals a pull-back in the G7 offset by a further recovery in the E7 – third chart. The G7 / E7 gap, however, remains positive, suggesting slightly more favourable prospects for developed than emerging markets.
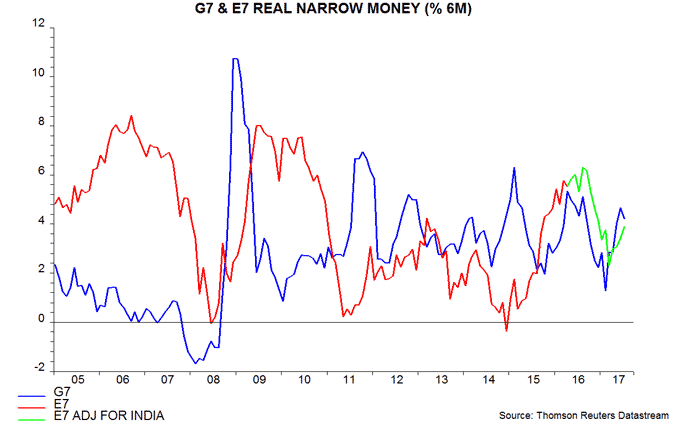
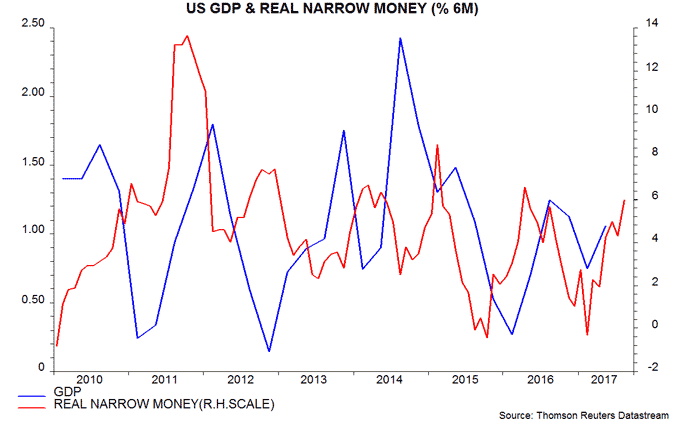
The July decline in G7 real narrow money growth may be reversed in August: US growth appears to have risen further last month, based on available weekly data – fourth chart**. The US pick-up increases confidence in the view here that the US economy will be strong in late 2017 / early 2018, with a modest near-term drag from Hurricane Harvey swiftly reversed.
*”Global” = G7 major economies and seven large emerging economies. Narrow money has been adjusted to reduce a distortion due to India’s demonetisation programme.
**Final real money growth data point = August estimate.

