
Entries from September 1, 2017 - September 30, 2017
UK money trends improving
 Simon Ward
 Post a Comment
UK money trends have firmed since early 2017, suggesting that GDP growth will recover from its soft first-half pace.
Non-financial M1 – which, as in Euroland, outperforms other monetary aggregates as a leading indicator of the economy – rose by a solid 0.7% in August following a 0.4% July gain. Six-month growth bottomed in March and moved up to 3.7% or 7.5% annualised in August, very close to the Euroland pace – see first chart and previous post.
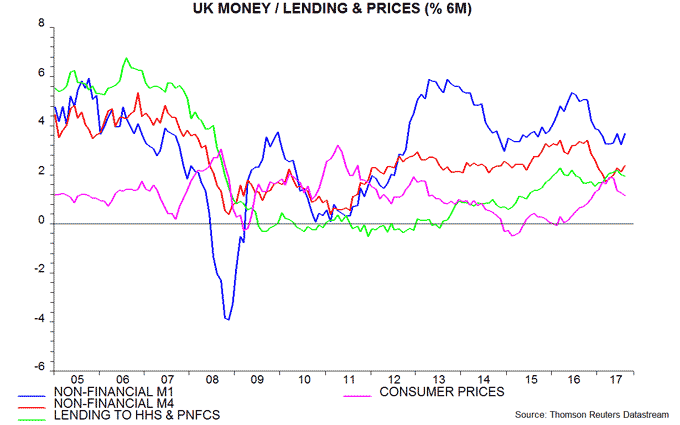
The broader non-financial M4 measure rose by 0.6% in August after 0.1% in July, while its six-month growth increased to 2.4% or 4.8% annualised – the fastest since December 2016.
The turnaround in six-month real (i.e. inflation-adjusted) money growth has been more pronounced because the six-month rate of increase of consumer prices (seasonally adjusted), while still elevated, has moderated from a peak in April – first and second charts. Real money growth, however, is lower than over 2014-16, suggesting that GDP expansion will remain subdued by recent standards.
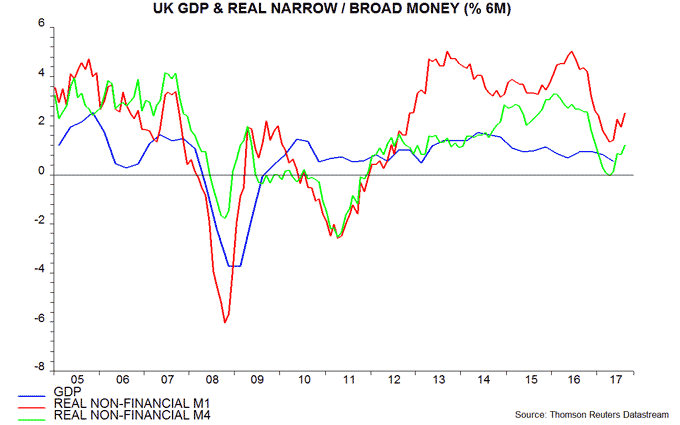
The sectoral split of non-financial M1 supports a modestly positive interpretation, with growth of real money holdings of both households and private non-financial corporations (PNFCs) firming recently. Corporate growth is at a respectable level by historical standards, consistent with businesses maintaining expansion plans despite Brexit uncertainty.

The Office for National Statistics today released national accounts revisions through the second quarter of 2017 as well as July services output. GDP growth in the second quarter was unchanged at 0.3% but first-quarter expansion was revised up from 0.2% to 0.3%. Growth estimates for the third and fourth quarters of 2016, however, were lowered, i.e. the slowdown between the second half of 2016 and first half of 2017 was less pronounced than previously reported.
Services output fell by 0.2% in July from June. Incorporating previously-released data on industrial and construction output, July GDP was only 0.1% above the second-quarter level. July services weakness, however, was mostly accounted for by a fall in motion pictures output, which is volatile and now below its recent trend. Assuming a rebound in such output, GDP is probably still on course to meet the Bank of England staff's projection of 0.3% growth in the third quarter.
Euroland August money numbers better but trends cooling
Euroland money measures rebounded from July weakness in August. Six-month growth, however, has fallen since early 2017, suggesting that GDP expansion will moderate in late 2017 / early 2018.
Non-financial M1 – the monetary measure with the strongest historical forecasting record, according to ECB research – rose by 1.0% in August, following no change in July. The broader non-financial M3 measure was up by 0.6%, having fallen 0.1% in July*.
Six-month growth of non-financial M1 moved back up to 3.8% (7.7% annualised) – solid by historical standards but well down from a March peak of 5.6% (11.5% annualised). Non-financial M3 growth has also cooled since then. Bank lending expansion has been stable but is a coincident / lagging indicator of the economy (confirmed by the ECB research) – see first chart.

The monetary slowdown has been mild in real (inflation-adjusted) terms because of a simultaneous decline in the rate of increase of consumer prices (seasonally adjusted) over the spring and summer. Real money growth, however, has pulled back sufficiently to suggest a slowing of economic momentum in late 2017 / early 2018 – second chart. Six-month inflation, moreover, is likely to rebound, so real money trends may weaken further.

Robust GDP growth of 1.2% or 2.4% annualised during the first half of 2017 partly reflected strong net exports, which may face headwinds from a 7.2% rise in the euro effective exchange rate between December and August. Domestic demand rose by 0.6% or 1.3% annualised in the first half – third chart.

Real narrow money trends were much stronger in Euroland than the US in late 2016, suggesting superior economic prospects. GDP expanded by an annualised 2.4% in Euroland between the third quarter of 2016 and second quarter of 2017 versus 2.0% in the US. With US real non-financial M1 growth now back above the Euroland level, the US economy is likely to outperform in late 2017 / early 2018.

*Non-financial = held by households and non-financial corporations.
US Q2 flow of funds: more reasons for economic optimism
The positive view here of US economic prospects for late 2017 / early 2018 is supported by additional monetary data in the Fed’s second-quarter financial (flow of funds) accounts released yesterday.
Previous posts have highlighted a strong pick-up in six-month growth of real narrow money, as measured by M1A divided by consumer prices, since early 2017*. The preferred narrow money measure here, however, is non-financial M1, i.e. covering holdings of households and non-financial businesses but excluding the financial sector. This can be derived from the financial accounts but the numbers are quarterly and lag the monthly M1 / M1A data by two months.
Figures through end-June show that real non-financial M1 has accelerated even more strongly than real M1A. Six-month growth, indeed, was the highest since early 2014, ahead of two quarters of 4% plus annualised GDP expansion – see first chart.

Broad money trends, meanwhile, remain stable and solid. The Fed stopped publishing M3 in 2006 but a close substitute can be reconstructed from the financial accounts. Total and non-financial M3 grew by 6.1% in the year to June – second chart.

The financial accounts also include data on sectoral net lending, i.e. saving minus investment. The household and domestic business sectors ran stable surpluses in the second quarter, of 1.5% and 0.6% of GDP respectively – third chart. The business surplus suggests favourable prospects for investment and hiring – no recession since 1950 (at least) began with the business sector in surplus.

The combined household / business surpluses reflect a general government deficit of 4.7% of GDP – worryingly large for an economy at or near full employment. There is, of course, little prospect of this being cut back any time soon and a significant risk of further widening if the Trump administration and Congressional Republican majorities coalesce around unfunded tax cuts.
*M1A = currency in circulation plus demand deposits. M1 also includes other checkable deposits. The two measures have behaved similarly in recent years. M1A is preferred for the historical reason that M1 was heavily distorted by sweep account programmes in the 1990s.
US inflation: is the Phillips curve about to bite back?
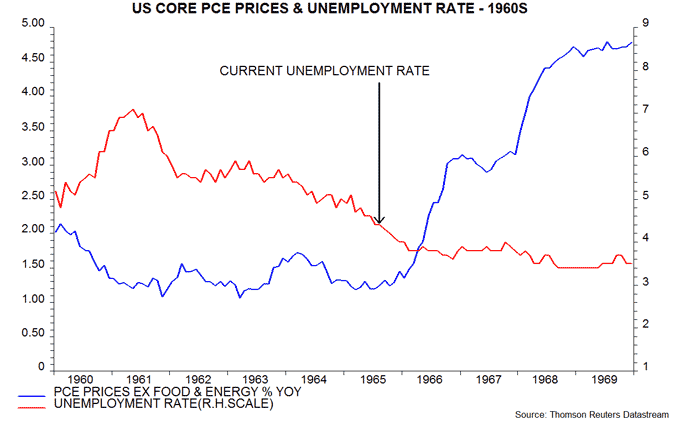
The lack of response of US core inflation to a tightening labour market in recent years echoes experience in the first half of the 1960s. Then, core inflation embarked on a sustained rise only after the unemployment rate fell below 4.5% and then 4% in 1965-66. The jobless rate is currently 4.4% and, on the expectation here of solid economic growth in late 2017 / early 2018, may soon reach 4% or lower. The risk of a “non-linear” inflation response to a further unemployment decline may contribute to the Fed raising rates by more than markets expect by spring 2018.
The three-month rate of change of core consumer prices (i.e. excluding food and energy) rebounded to 1.9% annualised in August, equalling its average over 2012-16. This supports the argument in a previous post that weak core data earlier in 2017 reflected pay-back for an overshoot last winter together with a temporary drag from a large drop in the measured price of wireless telephone services. A narrower core measure excluding such services rose at a 2.1% annualised pace in the latest three months – see first chart.

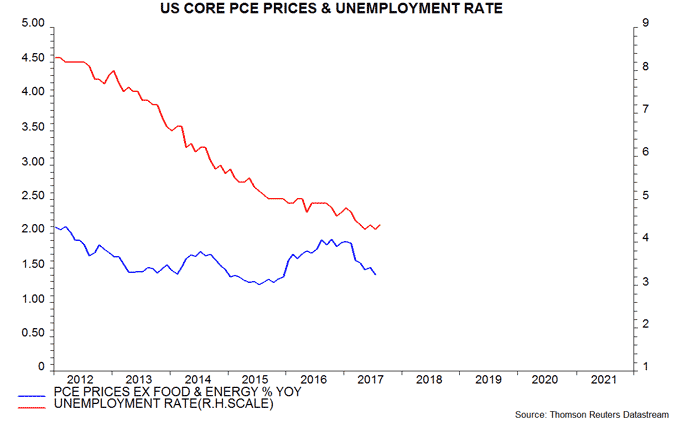
Standing back from recent volatility, however, core inflation has, as yet, shown no response to a large fall in the unemployment rate and wider measures of labour market slack in recent years. The Fed’s preferred core inflation measure, the annual change in the personal consumption expenditures (PCE) price index excluding food and energy, has remained below 2% despite the jobless rate falling from more than 8% to 4.4% since 2012 – second chart.
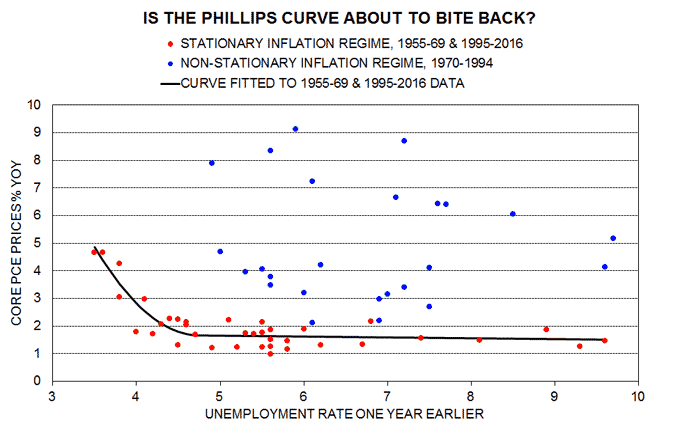
Recent experience does not, as is sometimes suggested, represent an anomaly by historical standards. Core inflation also remained below 2% over 1961-65 as the unemployment rate fell from over 7% to 4.5%. The core rate rose sharply, however, after the jobless rate moved below 4.5% in late 1965 and 4% in early 1966. Core inflation reached more than 3% by late 1966 and climbed further in 1968-69 as the labour market remained stretched – third chart.
As previously discussed, the forecast here, based on narrow money trends and the status of the Kitchin inventory cycle, is that the economy will grow robustly in late 2017 / early 2018, implying a further erosion of labour market slack. While the unemployment rate has stabilised at 4.3-4.4% since April, the jobs hard to find / jobs plentiful responses in the Conference Board consumer survey suggest that the trend remains down – fourth chart.

Fed officials are aware of the risk that the “Phillips curve” relationship between core inflation and labour market slack will steepen as the labour market continues to tighten. A 2016 Fed working paper found evidence, not confined to the 1960s, for such a non-linear effect, concluding that “it would be unwise to assume the Phillips curve remains so flat at all levels of the unemployment rate”.
According to the paper, there have been two distinct inflation “regimes” since World War Two: a “stationary” regime, characterised by low, stable inflation expectations, covering the 1950s / 1960s and the period from the mid 1990s to the present; and a “non-stationary” regime in the 1970s, 1980s and early 1990s, when inflation expectations became “unanchored” because of shocks and policy mistakes. Separate Phillips curve relationships should be estimated for the two regimes.
Simplifying the analysis in the paper, the following chart shows a scatter plot of core inflation against the unemployment rate, lagged by one year, using annual data from 1955 to the present. There is no correlation across the data set as a whole (red and blue dots) but a Phillips curve can be fitted to the stationary regime data points alone (red dots). This curve is almost flat at unemployment rates above 4.5-5.0% but steepens progressively below this range.
Weak core inflation readings and a stabilisation of the unemployment rate since spring 2017 have caused some Fed officials to doubt the urgency of further policy tightening. With core price trends apparently normalising, a resumption of the fall in the jobless rate in late 2017 would be likely to shift the Fed’s focus back to inflationary risks from labour market overheating, strengthening the consensus in favour of proceeding with regular interest rate rises.
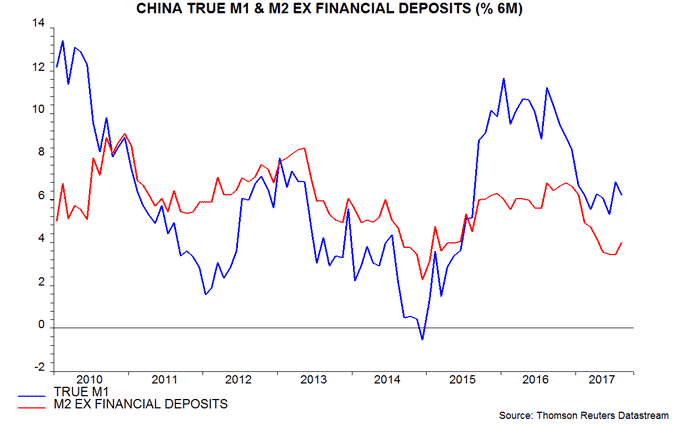
Chinese narrow money trends reassuring
Chinese narrow money continues to expand at a respectable pace, suggesting broadly stable economic growth and inflation through early 2018.
Six-month growth of the “true M1” measure tracked here fell significantly in late 2016 / early 2017 but has stabilised in recent months at about 6%, or 12% at an annualised rate. This is around the middle of the range in recent years and well above levels reached in 2014 ahead of significant economic weakness – see first chart.
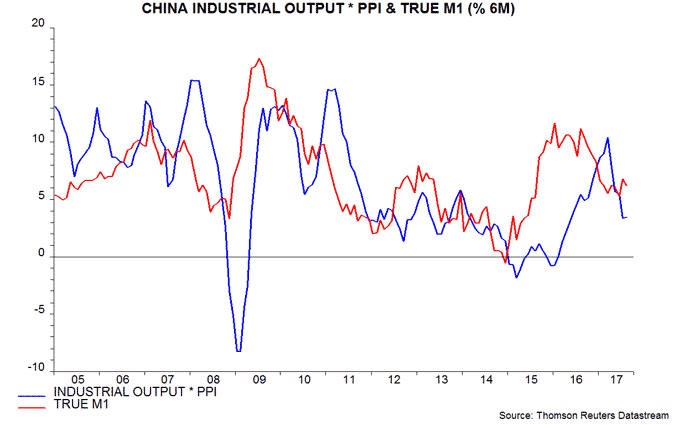
The earlier monetary slowdown has been reflected in a moderation in growth of nominal GDP and nominal industrial output, the latter proxied by multiplying the volume of output by producer prices – first chart. With narrow money growth stable since the spring, nominal output growth is unlikely to fall much further and may recover into early 2018.
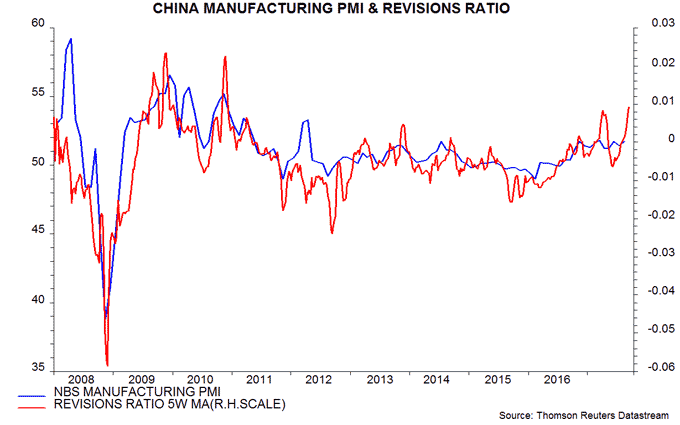
Six-month growth of the volume of industrial output fell further in August but this may reflect supply-side influences – adverse weather and anti-pollution restrictions – rather than demand weakness. Consistent with this explanation, six-month producer price inflation ticked up, with a significant jump in prices in August alone – second chart.

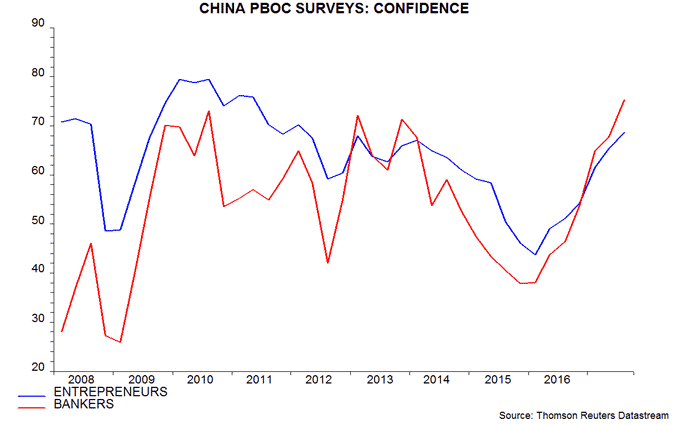
The suggestion that nominal economic growth is holding up is supported by earnings trends, with the equity analysts’ revisions ratio moving back into positive territory recently – third chart. The PBoC’s third-quarter surveys of entrepreneurs and bankers, meanwhile, were upbeat, reporting further rises in confidence levels and profitability assessments – fourth chart.
Broad money is lagging narrow money: six-month growth of M2 excluding financial sector deposits, the preferred broad measure here, is near the bottom of its range in recent years, though ticked up in August – fifth chart. The higher level of narrow money growth, however, indicates that broad money weakness is not (yet) negatively affecting spending plans, probably because the improved economic climate has resulted in a decline in the demand to hold precautionary money balances.
UK MPC on course for November rate hike
Today’s communications suggest that the UK MPC will hike Bank rate to 0.5% on its next decision date of 2 November barring downside data surprises or market turbulence.
According to the minutes, a majority of members judged that, if the economy remains on the expected path, “some withdrawal of monetary stimulus was likely to be appropriate over the coming months”.
The unreliability of previous forward guidance increases the pressure on the Committee to follow through on this signal at the earliest opportunity.
The hawkish shift has been driven by recent data indicating stronger-than-expected activity and inflationary pressures – see previous post.
Key data inputs to the November decision will be September consumer price inflation and the preliminary estimate of third-quarter GDP growth, scheduled for release on 17 and 25 October respectively. The judgement here is that inflation would need to fall back to 2.7% or below and growth to undershoot the Bank of England staff’s 0.3% projection to head off a hike.
Major national accounts revisions due to be released on 29 September may also play into the MPC’s decision. The Office for National Statistics has already indicated that growth of household income and the level of the saving ratio over 2010-15 were higher than previously reported – see previous post. A similar upgrade to 2016-17 data could allay some MPC members’ concerns about the impact of a rate hike on consumer spending.
