
Entries from September 1, 2016 - September 30, 2016
UK note data suggesting continued retail strength
 Simon Ward
 Post a Comment
UK retail sales surprised positively again in August, as had been suggested by data on notes and coin in circulation – see previous post. Weekly numbers on the note issue have strengthened further so far in September, hinting that high-street spending has remained firm.
Retail sales volume declined by only 0.2% in August after an upwardly-revised 1.9% gain in July. Annual growth was stable at 6.2%. Continued strength had been suggested by buoyant annual growth of real (i.e. consumer price inflation-adjusted) notes and coin – see first chart.
Currency in circulation appears to have accelerated further in early September. Annual growth of the note issue averaged 9.7% in the first two weeks, up from 8.8% in August – second chart.
Retail sales volume feeds into the output measure of GDP with a 5.6% weight. If September sales were to equal the July / August average, the third-quarter rise would be 1.5%, implying a 0.1 percentage point contribution to GDP growth. As noted in yesterday’s post, vacancies numbers are consistent with quarterly GDP expansion of 0.4%. The Bank of England has revised its third-quarter growth forecast from 0.1% to 0.3% and may be forced to upgrade further.


Chinese money trends still strengthening
Chinese monetary trends continue to give an unambiguously positive message for near-term economic prospects.
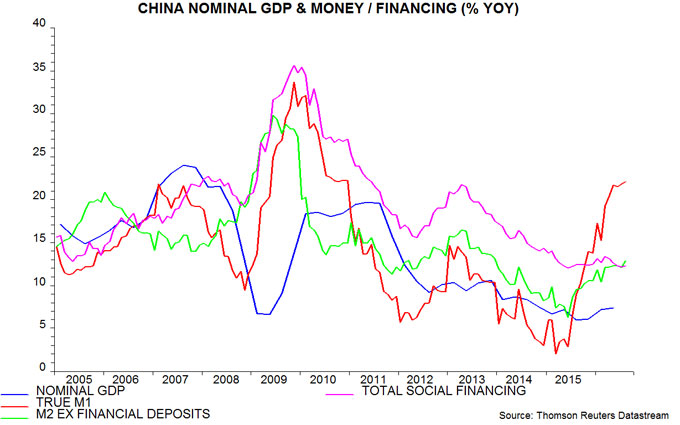
The preferred narrow and broad money measures here are “true” M1 and M2 excluding financial deposits. True M1 includes household demand / temporary deposits, which are omitted from the official M1 aggregate. Financial deposits within M2 are volatile and appear unrelated to current or prospective economic developments.
Annual growth of true M1 rose to 22.1% in August, with M2 ex financial deposits expansion up to 12.8% – the fastest since 2011 and 2013 respectively. The continued upswing signals further nominal GDP acceleration over coming quarters – see first chart.

The second chart shows six-month changes in industrial output and real true M1 / M2 ex financial deposits (i.e. deflated by consumer prices). The real money growth measures had moderated from late 2015 / early 2016 peaks but shot up again in August, reaching new highs – second chart.

Some recent commentary has claimed, bizarrely, that the large gap between narrow and broad money growth is a negative signal for economic prospects. There is no theoretical or empirical basis for this view. Money held in narrow form is more likely to be spent. The gap was last similarly large in 2010 ahead of a sustained period of strong economic growth. G7 evidence confirms that changes in the gap are positively, not negatively, correlated with future growth.
The size of the gap is of much less significance than the fact that both narrow and broad money are accelerating, in both nominal and real terms.
Another claim is that economic recovery has been achieved at the expense of unsustainable credit expansion. Annual growth of total social financing (TSF) of 12.3% in August, however, was barely above a multi-year low of 12.0% reached in June 2015 – third chart. TSF continues to outpace nominal GDP expansion by a wide margin but the gap is likely to narrow. The TSF / GDP ratio will reach a limit at some point but when and at what level are unknowable.
UK vacancies data suggesting Q3 economic resilience
The working assumption here has been that the immediate growth hit from the Brexit vote shock would be modest, reflecting supportive monetary trends and an improving global economic environment. A previous post argued for ignoring the high-profile but unreliable purchasing managers’ surveys and focusing on official labour market data – particularly vacancies numbers – to assess the validity of this assumption.
New data this morning support the baseline view. The stock of vacancies actually rose in the three months to August from the previous three months, partially reversing a fall in early 2016. The latest three-month change is consistent with quarterly GDP / gross value added (GVA) growth of about 0.4% – see first chart.
Claimant-count unemployment numbers were also reassuring, though are judged here to be less significant – vacancies are a coincident indicator of economic activity while the claimant count usually responds with a short lag. The number of claimants was unchanged in August from three months before, again suggesting quarterly GDP / GVA expansion of 0.4% – second chart.
July services turnover numbers due for release on 19 September will provide more clues on current-quarter growth.


Chinese growth pick-up on track
Better Chinese activity data for August support the view that the economy is gaining momentum – contrary to the consensus forecast of a second-half slowdown. Firmer growth had been signalled by narrow money trends (allowing for the usual lag) and the OECD’s leading indicator.
Annual industrial output growth rose from 6.0% in July to 6.3% in August, the fastest since June 2015 excepting March’s 6.8%, which was artificially boosted by a New Year timing effect. The August result may have benefited from catch-up production after disruptions caused by bad weather in July, as well as more working days. However, there was an offsetting downward distortion from factory closures around Hangzhou to improve air quality ahead of the recent G20 meeting.
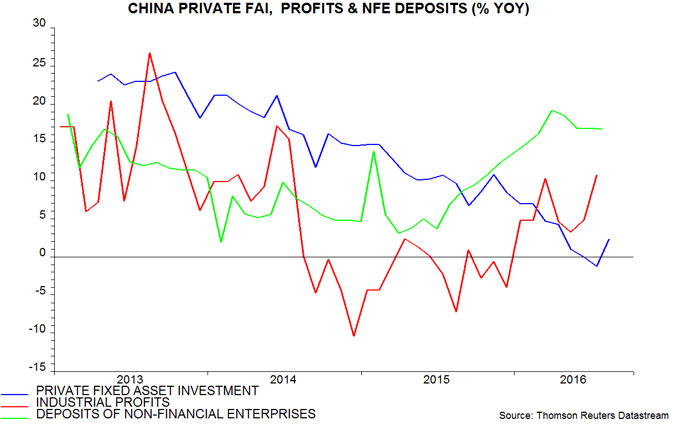
Economic concerns have focused on private-sector investment, which contracted in nominal terms in July compared with a year earlier. Previous posts argued that this weakness reflected a lagged response to falling profits in 2014-15; with profits reviving in early 2016, and money holdings of enterprises rising strongly, a second-half recovery in investment was expected. The annual change rebounded to +2.3% in August – see chart.
Profits are being lifted by rising producer prices, which increased again in August – the fifth gain in the last six months.
Annual growth in retail sales, meanwhile, strengthened from 10.2% in July to 10.6% in August, or 9.6% allowing for consumer goods inflation of 0.9%. Auto sales were particularly strong, rising by an annual 13.1%, probably partly reflecting the approaching (year-end) expiry of tax incentives – sales growth is likely to weaken sharply in early 2017.
The OECD’s leading indicator strengthened further in July – see previous post. August monetary data later this week will provide clues about the sustainability of the current upswing beyond early 2017.
OECD leading indicators confirming global economic acceleration
The OECD today released three months’ worth of data on its composite leading indicators for OECD countries and major emerging economies, following a bizarre decision to suspend publication over the summer because of supposed Brexit-related uncertainty. The indicators signal an emerging markets-led pick-up in global growth, confirming the message from recent narrow money trends.
The first chart shows six-month changes in G7 plus emerging E7 industrial output, real narrow money and a leading indicator derived from the OECD country data. Real narrow money growth started to pick up in late 2015, with leading indicator momentum following in early 2016. Industrial output has shown signs of life in June / July, while the leading indicator has gained further strength.

The second and third charts show the E7 and G7 groupings separately. The upswing in the aggregate leading indicator has been driven by the E7 component but G7 weakness has abated, with G7 narrow money trends suggesting further improvement. The E7 pick-up has been broadly based among the constituent countries but China has been a major contributor, consistent with earlier narrow money buoyancy – fourth chart.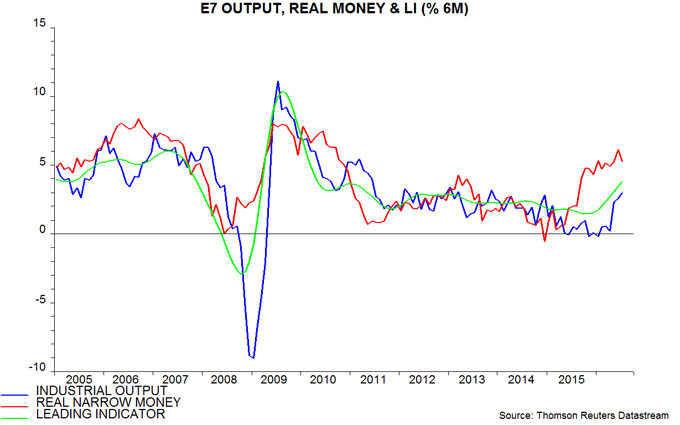


UK money trends signalling further nominal GDP acceleration
A rise in UK money growth over the past year signals faster nominal GDP expansion over coming quarters. The Brexit uncertainty shock and associated sterling weakness suggest that higher inflation will drive the pick-up, although output growth is also likely to exceed consensus expectations.
The chart shows annual growth rates of nominal GDP and the narrow / broad money measures tracked here – non-financial M1 and M4 – along with the Bank of England’s M4ex broad measure*. A directional leading relationship is apparent between non-financial M1 growth and nominal GDP expansion. The relationship is looser but still visible for the broader measures, with non-financial M4 outperforming M4ex.
Annual growth rates of non-financial M1, non-financial M4 and M4ex have been rising since June 2015, February 2015 and November 2014 respectively. Consistent with the “monetarist” relationship, nominal GDP expansion has recovered from a low reached in the third quarter of 2015. The lead time between non-financial M1 growth and nominal GDP expansion has averaged 7.5 months at the four turning points since 2010, suggesting that nominal GDP will continue to accelerate through early 2017, at least.
The pick-up in annual growth of the Bank’s M4ex measure was modest until May, reflecting falls in money holdings of financial corporations, i.e. fund managers, insurance companies / pension funds, securities dealers etc. These holdings, however, have surged at a 70.0% annualised rate over the past three months, pushing annual growth of M4ex above that of non-financial M4.
The prospect of a further rise in nominal GDP growth casts doubt on the wisdom of the MPC’s recent easing moves. The decision to launch more QE with M4ex growing by 6.9% annually and at a 14.7% annualised pace in the latest three months is particularly questionable. The MPC is, in effect, gambling that the Brexit shock will cause the recent monetary pick-up to reverse but there was no sign of weakness in the July-only data.

*The non-financial measures cover holdings of households and private non-financial firms. M1 = notes / coin plus sterling sight deposits. M4 additionally includes sterling time deposits, money funds, repos and short-term bank securities. M4ex = non-financial M4 plus M4 holdings of non-bank financial corporations, excluding intermediaries.
