
Entries from September 1, 2016 - September 30, 2016
UK confidence returning, money trends still solid
 Simon Ward
 Post a Comment
UK survey and monetary data released today give a positive message about current economic performance and near-term prospects, suggesting no need for further monetary policy easing and questioning the scale of the MPC’s August actions (although Bank of England Governor Carney will try to claim credit for economic resilience).
Annual growth of narrow and broad money rose further in August. The Bank’s M4ex measure is now expanding at a 7.3% annual rate, the fastest since 2008. Stronger money growth has already been reflected in a pick-up in nominal GDP expansion, which may continue to rise into mid-2017, at least – see first chart.
The EU Commission’s monthly business surveys for September, meanwhile, showed further recoveries in confidence in services, retailing and construction. The surveys are mostly conducted by the CBI and the same information is included in the CBI’s expected growth indicator, which has a similar correlation with GDP changes to the more widely-watched composite PMI. Based on the EU data, the CBI indicator is likely to have recovered to a “normal” level in September – second chart.
The EU Commission’s consumer confidence measure also rebounded significantly last month, to a strong level by historical standards – third chart.
Tomorrow’s July services output data will be a key input to the preliminary third-quarter GDP estimate released in late October – see previous post. Based on current information, a quarterly GDP rise of 0.4% looks possible, far above the original Bank staff projection – at the time of the August policy easing – of no change, since revised to an increase of 0.2%.
Returning to the monetary data, the non-financial M1 and M4 measures tracked here rose solidly again in August, by 0.7% and 0.5% respectively. Six-month growth of real non-financial M1 (i.e. deflated by consumer prices) has risen over the past year, though may have peaked in June. Real non-financial M4 growth has been broadly stable. There is no suggestion in these trends of an imminent sharp economic slowdown – fourth chart.
Recent buoyancy in retail spending was signalled by a strong pick-up in six-month real household M1 growth in late 2015 / early 2016. The pace has cooled but remains solid. Real M1 growth of private non-financial corporations (PNFCs), meanwhile, has recovered from a pre-referendum slowdown, suggesting that business expansion plans are holding up better than feared.
The Bank’s M4ex broad money measure rose by only 0.1% in August but this followed a bumper 3.5% increase over the prior three months. The August rise was suppressed by a 2.2% decline in financial institutions’ M4 holdings, following a 14.1% surge over May-July. The latter increase may have partly reflected institutions’ raising precautionary cash before and immediately after the referendum. The August fall would probably have been larger but for the MPC’s decision to restart gilt purchases.
Eurozone money signal still positive
The consensus forecast is for Eurozone GDP growth to slow from 1.5% in 2016 to 1.2% in 2017. Monetary trends suggest that this is too downbeat and GDP will continue to rise at a 1.5-1.75% annual rate – it increased by 1.6% in the year to the second quarter. Such growth would be comfortably above trend economic expansion estimated by international forecasting bodies at about 1% per annum, implying a continued decline in unemployment and – probably – firmer “core” inflation.
Some commentary before today’s release of August data expressed concern about a cooling of monetary trends. Annual growth of narrow money M1 was 8.4% in July, well down from a peak of 11.8% in July 2015, with M3 expansion easing to 4.8%, a three-month low. The August numbers were better, showing annual growth of 8.9% and 5.1% respectively.
The earlier concern was not shared here, on the grounds that the headline M1 / M3 numbers were being pulled down by a decline in growth of financial institutions’ deposits, which contain little information about near-term economic prospects. Annual growth of non-financial M1 – comprising holdings of households and non-financial corporations – was 8.9% in July, increasing to 9.3% in August. Non-financial M3 expansion rose to 5.6% last month, the fastest since 2008 – see first chart.

A further reason for remaining sanguine was / is that earlier policy easing has yet to have its full impact on monetary conditions. Interest rates on new bank loans, for example, are still declining, with potential positive effects on credit demand and monetary expansion – second chart.
Annual growth of bank loans to the private sector remains weak, at 1.7% in August, but is trending gradually higher, with the ECB’s bank loan officer survey signalling rising credit demand – third chart.

Solid monetary growth since 2013 has lifted domestically-generated inflation – as measured by the annual change in the GDP deflator – to 1.1% as of the second quarter, as well as delivering respectable economic expansion. Nominal GDP rose by 2.8% in the year to the second quarter, outpacing increases of 2.4% in the US and 1.5% in Japan, though below a 2.9% UK gain. Eurozone deflation risk was and remains low.
Chinese reflation on track, profits surging
Chinese industrial profits surged in August, providing further confirmation that the economy is strengthening, as signalled by monetary trends since late 2015.
Profits rose by 19% in August from a year before, the fastest annual growth rate since 2013. The August result was flattered by a favourable base effect but underlying growth is well into double-digits. Profits of state-owned enterprises were 39% higher in August than a year before, though had slumped by 49% in the previous 12 months – see first chart.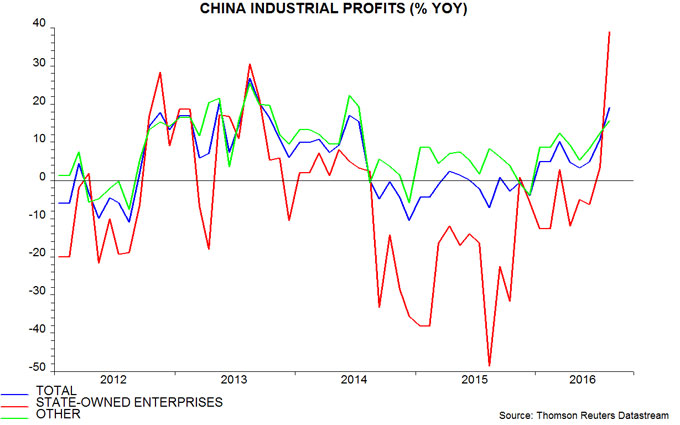
A fall in profits in 2015 contributed to weakness in private fixed asset investment through summer 2016. Previous posts suggested that this year’s profits rebound, and an accompanying pick-up in growth of enterprise money holdings, would feed through to a revival in investment later in 2016 and in 2017. August investment results provided tentative support for this view, with the annual change in the private component recovering to a four-month high.
Monetary reflation is following the usual pattern. The surge in narrow money began in spring 2015 and was immediately reflected in a change in trend of house prices. A recovery in profits followed from late 2015. Annual narrow money growth rose to a new high in August, suggesting that annual house price inflation and profits growth are still some way from peaking – second chart.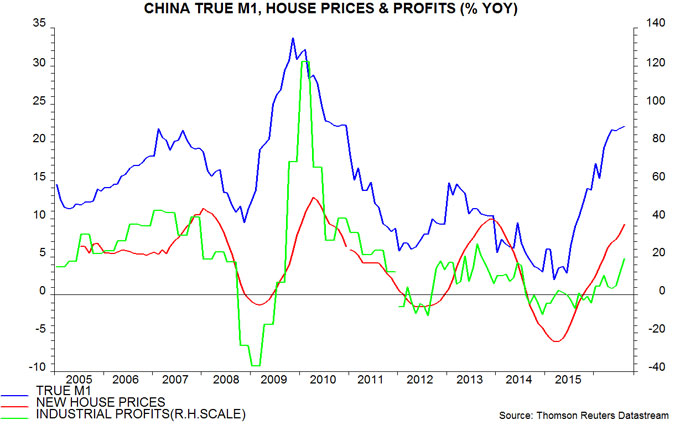
The usual pattern implies that investment and industrial output growth will now strengthen: profits and output cycles have been closely entwined historically – third chart. Stronger industrial activity, in turn, would be expected to feed through to a further recovery in pricing power and faster nominal GDP expansion.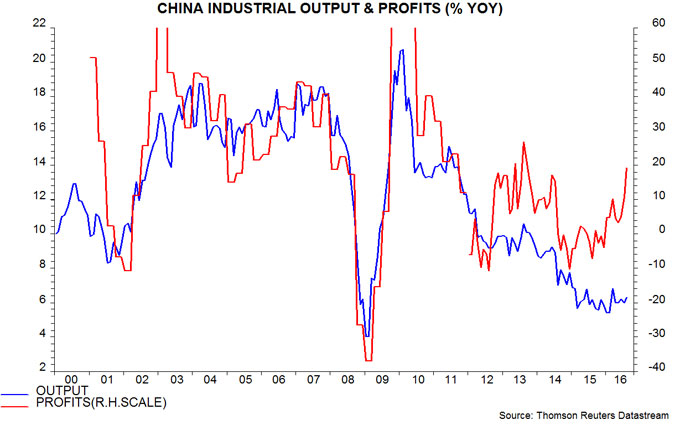
In this scenario, monetary policy would probably shift from its current easing bias towards modest tightening, suggesting a reduction in capital outflows and re-emergence of upward pressure on the exchange rate from the large current account surplus.
UK services data suggesting respectable Q3 GDP rise
The Office for National Statistics will release a July number for the index of services on 30 September. This number will be a key input to the preliminary estimate of GDP in the third quarter, to be released on 27 October. The indications are that services output rose solidly in July, in turn suggesting that the preliminary GDP estimate will show respectable quarterly growth – possibly as high as 0.4%. Such an outcome would add to doubts about the necessity of the MPC’s August easing package and could block the further rate cut apparently desired by a majority of Committee members.
There are two reasons for expecting the July services number to be solid. First, retail services output has a 7.1% weight in the index and is measured by retail sales volume, which rose by 1.9% in July, implying a contribution of 0.1 percentage points.
Secondly, services turnover data for July released earlier this week suggest that output increased in a number of other industries.
Translating the turnover data into a forecast for output is not straightforward and attempts here to draw inferences in the past have not always been successful. The difficulties include: turnover is measured in current price terms and is not adjusted for seasonal factors or working days; the turnover survey omits some important output components, including financial services, government activities and imputed rent; and the industry shares in the turnover data differ from the weights used in the output index.
The chart compares a subset of the output index accounting for 58% of the total with an estimated series for real turnover adjusted for seasonals / working days and weighting differences. This series has tracked monthly output changes reasonably well and suggests a further solid increase in July.
Based on the above, total services output may have risen by 0.4% in July, assuming no significant weakness in components for which there is little or no information.
Combined with already-released data on industrial and construction output, such an increase would imply that GDP in July was 0.3% above the second-quarter level. The preliminary third-quarter GDP estimate will also take into account August industrial / construction data (to be released on 7 and 14 October respectively) and early results of the August turnover survey, with statistical methods used to estimate September numbers. These methods are likely to extrapolate recent growth, implying the possibility of a 0.4% quarterly GDP increase barring weakness in the August data.
A 0.4% rise would also be consistent with July / August vacancies data – see previous post.
At its July meeting, the MPC judged that the Brexit vote “was likely to depress economic activity in the near term”. The Committee was more explicit in August, expecting “little growth in GDP during the second half”, with the Bank’s staff forecasting that that the preliminary third-quarter estimate would show no change from the second quarter. Better data forced an upgrade in September but the MPC still anticipated “a material slowing of UK GDP growth”, with the staff estimating a preliminary third-quarter increase of only 0.2%.
Third-quarter growth of 0.4%, with the possibility of a future upward revision, would, therefore, raise question marks about the MPC’s pre- and post-Brexit vote analysis and policy strategy. It could be difficult, in these circumstances, for the Committee to follow through on its strong guidance of a further cut in Bank rate to 0.1% (although Governor Carney’s tendency to find alternative rationales for a desired course of action should not be discounted).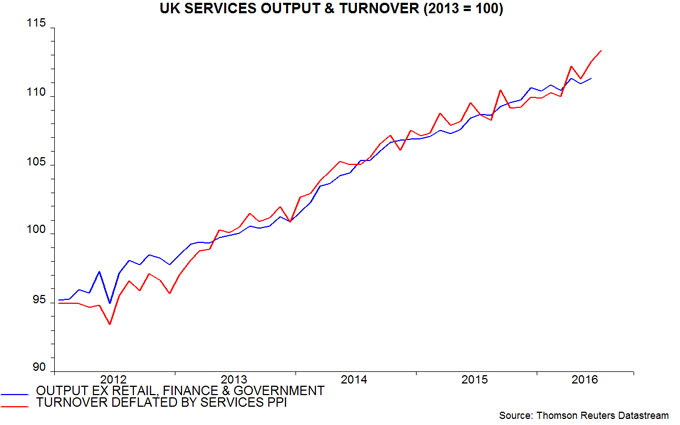
BoJ reaction: yield target boosts medium-term inflation risk
The Bank of Japan announced changes to its monetary policy strategy that will have little impact on current monetary conditions but are potentially significant for the medium term. Markets have reacted with relief that the BoJ rejected the option of cutting the policy rate deeper into negative territory, a move that would have raised further doubts about financial-system health.
The two key changes are: first, the abandonment of quantitative goals for JGB purchases and monetary base expansion in favour of a target, currently set at “around zero”, for the 10-year JGB yield; and secondly, a commitment to keep expanding the monetary base until consumer price inflation (as measured by the CPI excluding fresh food) overshoots the 2% target “in a stable manner”.
The shift to a yield level target set at zero will have little impact on current market conditions but suggests that policy will be more inflationary over the medium term. Under the previous strategy of QE targets, a rise in inflation would have been expected to be matched by a firming of JGB yields, keeping real yields broadly stable. The new peg at zero will force real yields lower as inflation picks up – policy, in other words, will become more expansionary as inflation rises towards the target, consistent with the BoJ’s new goal of achieving a sustained overshoot.
A yield level target also implies that the US-Japanese differential will be driven solely by Treasury yields. Stronger US growth and a hawkish Fed, therefore, should put more upward pressure on the US dollar / yen exchange rate than under the previous strategy.
Some commentary may interpret the changes as disappointing and evidence that the BoJ is running out of ammunition. The judgement here is that there was no need for another bazooka shot – strong monetary trends, improving global economic prospects and a tight labour market suggest a pick-up in growth and further progress in reviving inflation. The BoJ’s backpedalling on negative rates and implied commitment to falling real yields are positive developments for the equity market, which will continue to benefit from BoJ buying of ¥6 trillion per year, equivalent to 1.9% of TOPIX market cap.
Will the global economy boom in 2017?
The forecasting approach employed here suggests a significant probability of a global economic boom in 2017. If activity, instead, remains weak, it will indicate that the monetary transmission mechanism has failed and monetary indicators have gone haywire – with extremely bearish implications for asset prices.
There are four key reasons for adopting a boom as a central investment scenario:
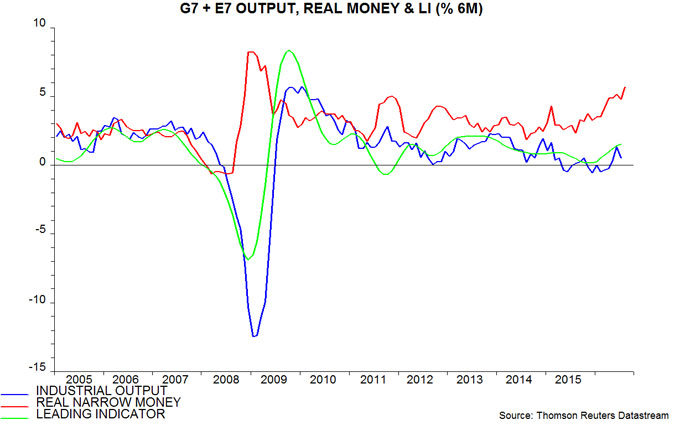
1) Global real narrow money is surging. Six-month growth of real narrow money in the G7 plus emerging E7 economies is estimated to have risen to about 5.5% (11.5% annualised) in August, the fastest since 2009, ahead of a sustained period of solid global expansion – see first chart. Monetary trends are strong across the major economies.
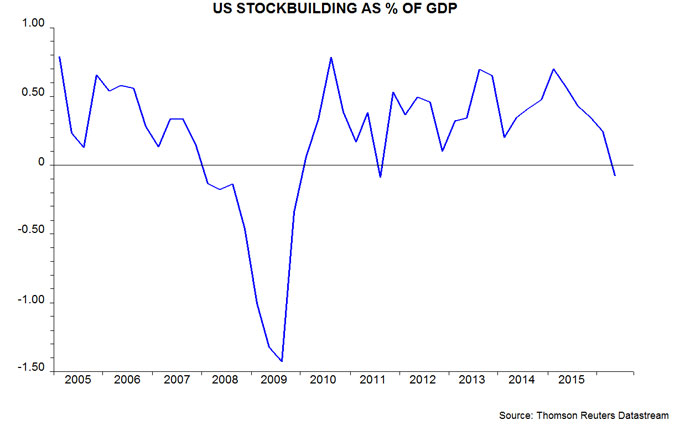
2) The US three- to five-year Kitchin stockbuilding cycle is probably at or near a low. Downswings in this cycle are associated with US / global economic slowdowns (e.g. 2011-12) or recessions if they coincide with weakness in the Juglar business investment and / or Kuznets housing cycles (e.g. 2008-09) – see previous post for more discussion. The change in inventories subtracted 0.8 percentage points from GDP growth in the year to the second quarter, turning negative in that quarter, suggesting that the current downswing is complete – second chart.
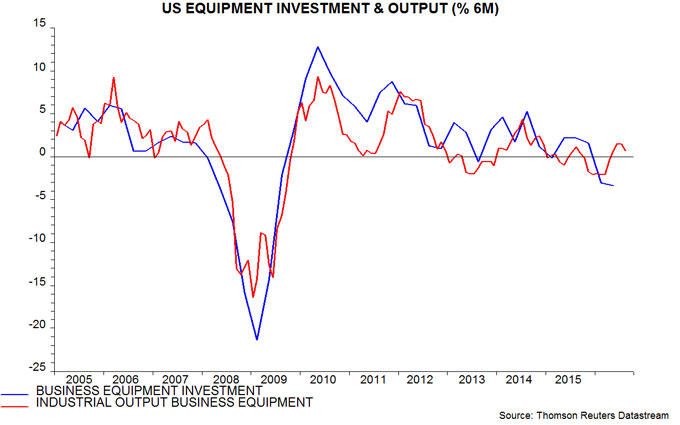
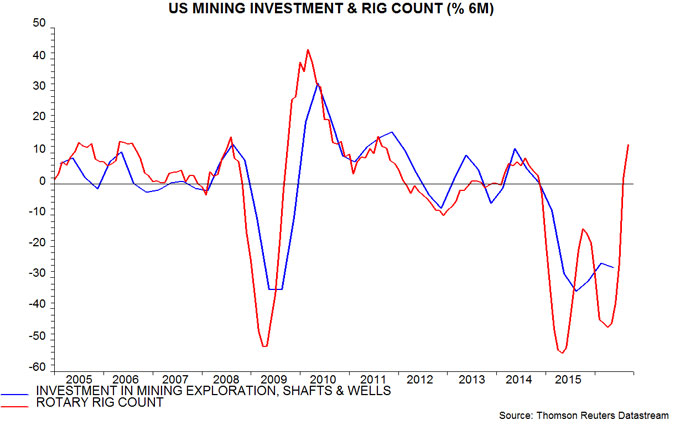
3) The US seven- to 11-year Juglar business investment cycle appears to be entering another expansion phase following a mid-upswing pause partly due to the oil bust. The cycle last bottomed in 2009 and is scheduled to reach another low between 2016 and 2020. A late date is now more likely, with recent data signalling a recovery in equipment and mining investment – third and fourth charts.
4) The OECD’s composite leading indicators are strengthening. Six-month growth in the G7 plus E7 trend-restored indicator calculated here from the OECD data is the strongest since 2014 – first chart.
Why could this forecast be wrong? The following objections to the above points have been raised in discussions:
1) Zero / negative rates have disrupted and may have destroyed the historical relationship between narrow money trends and future activity. Narrow money has been growing solidly for a while without this being reflected in stronger growth. Response: low rates have resulted in a faster fall in the velocity of circulation of narrow money but the directional relationship between changes in real money growth and output growth has remained intact. An adjusted real money growth measure incorporating a faster velocity decline and applying the historical average nine-month lead from money to activity has tracked output growth well and is signalling a strong upswing – fifth chart.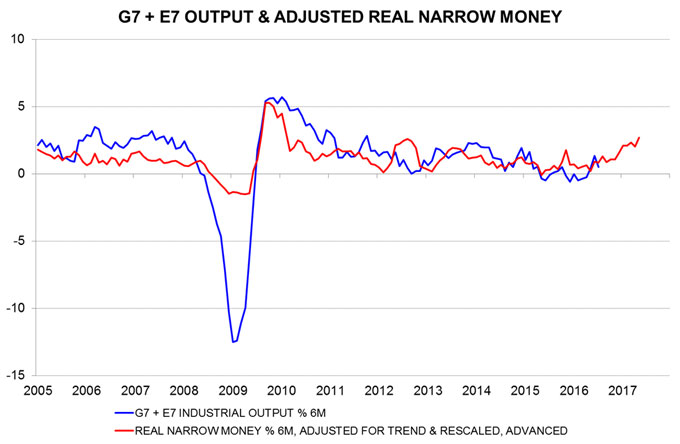
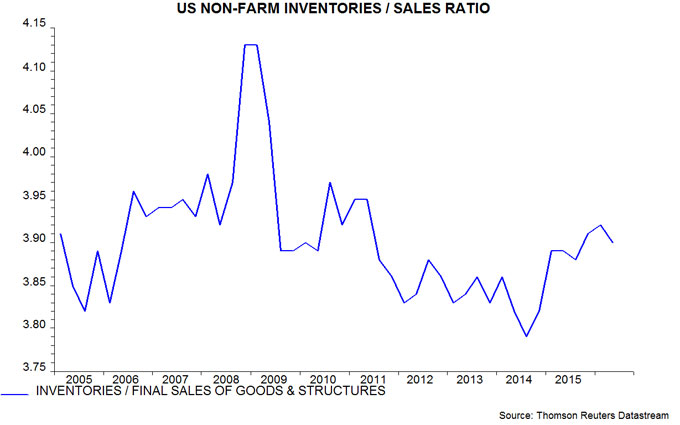
2) The US inventories to sales ratio remains elevated, suggesting that the Kitchin cycle downswing has further to run – sixth chart. Response: the cycle bottoms when the change in stocks has its maximum negative impact on GDP growth. This typically occurs soon after the inventories to sales ratio peaks but while it is still high – the current position. The ratio falls to normal or low levels only well into the upswing.
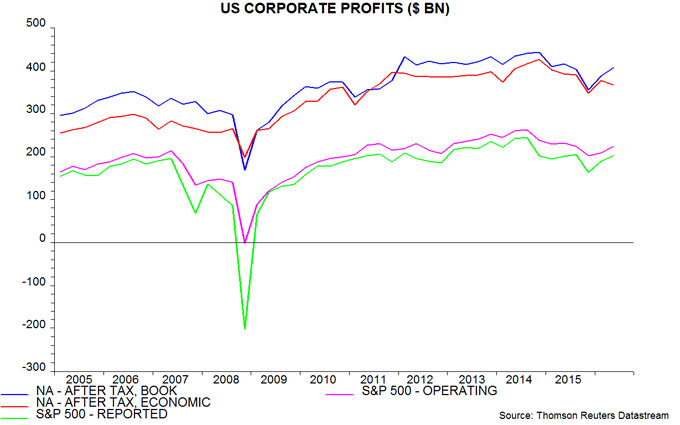
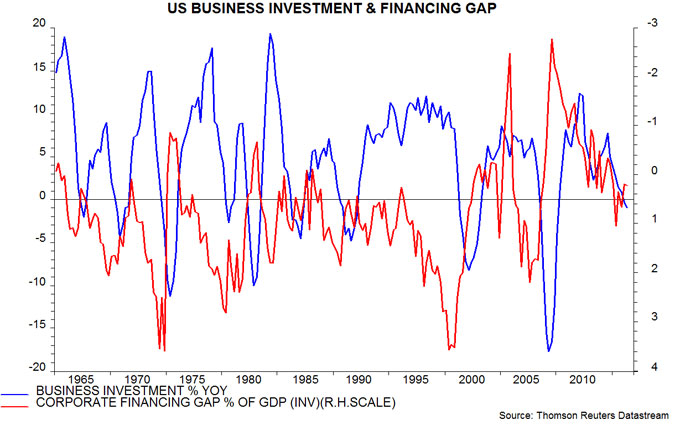
3) US profits remain weak, arguing against a pick-up in business investment. Response: profits fell between summer 2014 and late 2015, with energy extraction accounting for about half of the decline. There has, however, been a partial recovery so far in 2016, despite weak GDP growth – seventh chart. The corporate financing gap (i.e. the difference between capital spending and retained earnings), meanwhile, was a modest 0.2% of GDP in the second quarter, down from 1.0% in the second quarter of 2015; the gap is an inverse long leading indicator of investment – eighth chart. Low borrowing costs are an additional positive – the corporate BAA yield is currently 55 basis points below its five-year average.
4) The pick-up in the G7 plus E7 leading indicator has been driven by the E7 component, with the G7 component still weak – ninth chart. Response: the G7 leading indicator has started to turn up, while G7 real narrow money trends are strongly positive.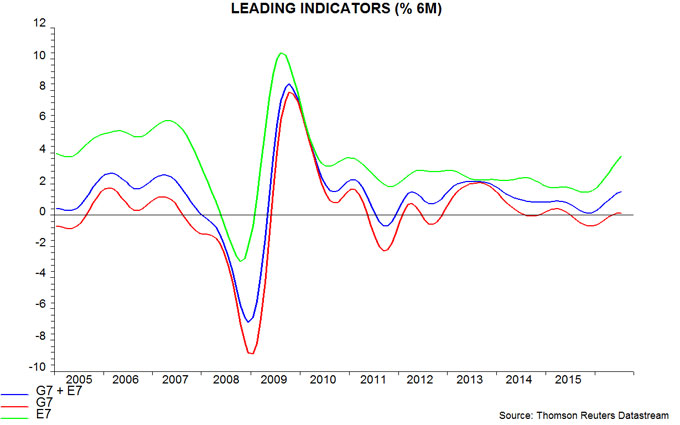
A forecast of economic strength will be maintained here but confidence in the scenario would be increased by a fall in the US inventories to sales ratio, a further recovery in US profits and confirmation of an upturn in the G7 leading indicator.
