Entries from November 1, 2016 - November 30, 2016
UK services turnover strong, GDP upgrade possible
Services turnover numbers for September suggest that output in the industries covered rose significantly from August, in turn raising the possibility that the official estimate of GDP growth in the third quarter will be raised from 0.5% to 0.6% – revised data will be released on 25 November. (Caveat: translating the turnover data into a forecast for output is not straightforward – see previous post.)
The current estimate of 0.5% GDP growth assumes that services output rose by 0.2% in September. The turnover survey covers nearly 60% of the sector and suggests an increase of at least 0.5% for this group. Unless output in the rest of the sector – dominated by government activities – fell, the 0.2% official growth assumption looks too low. A rise of 0.4% would probably be sufficient to trigger an upward revision to third-quarter growth.
Such an increase would also imply that the September level of GDP was 0.2% above the third-quarter average, implying solid growth “carry-over” into the fourth quarter. The 1.9% October rise in retail sales reported yesterday, meanwhile, will contribute +0.1 of a percentage point to the change in GDP in that month. Current evidence, therefore, appears consistent with GDP growth remaining at around 0.5% in the fourth quarter – contrary to the consensus forecast of a slowdown.
US narrow money growth moderating, warranting Fed caution
The Fed’s indifference to monetary trends contributed to it making two policy mistakes over the past 12 months. Is it about to make another?
The Fed hiked by 25 basis points in December 2015 and guided markets to prepare for four further quarter-point moves during 2016. Its hawkishness was in conflict with narrow money trends: six-month growth of real M1A* had fallen to a five-year low in October 2015, signalling that the economy would be weak over the winter and during the first half of 2016 – see chart. GDP growth averaged just 1.0% annualised in the fourth, first and second quarters. The Fed was forced to backtrack.
The second mistake was its failure to resume rate-hiking in summer 2016. Real narrow money growth had rebounded strongly from late 2015, suggesting a return to above-trend GDP expansion in late 2016 / early 2017. GDP rose at a 2.9% annualised pace in the third quarter, with similar growth expected in the current quarter (the Atlanta Fed’s “nowcast” model projects 3.6%). A summer hike would have put the Fed slightly “ahead of the curve” and might have prevented or tempered the recent sharp rise in inflation expectations and Treasury yields.
Fed Chair Yellen’s comments yesterday suggest that the central bank has turned hawkish again. Markets now discount a 91% probability of a December hike and a greater-than-50% likelihood of at least one further quarter-point increase by June 2017, according to the CME.
In contrast to late 2015 and summer 2016, narrow money trends do not argue strongly that the Fed is on the wrong track. Six-month growth of real narrow money has fallen back since August but remained respectable in October, suggesting solid economic expansion through spring 2017, at least. A further slowdown, however, would be concerning. Investors should monitor monetary trends and ignore Fed communications to assess policy prospects for later in 2017.
*M1A = currency in circulation plus demand deposits. Real = deflated by consumer prices.
Chinese reflation on track, RMB stable
Chinese monetary trends continue to give a positive message for economic prospects. The renminbi, meanwhile, has been stable recently, with weakness against a strong US dollar offset by appreciation against other constituents of the PBoC’s currency basket.
The official M1 and M2 money measures are regarded here as flawed – M1 excludes household demand deposits, which are relevant for assessing consumption prospects, while M2 trends in recent years have been distorted by large swings in financial sector deposits. The analysis in previous posts, therefore, has focused on M1 plus household demand deposits – “true M1” – and M2 excluding financial deposits.
Annual growth of true M1 reached a high of 22.1% in August and remained strong, at 21.3%, in October. Annual growth of M2 excluding financial deposits, meanwhile, rose further to 13.2% in October, the fastest since 2013 – see first chart.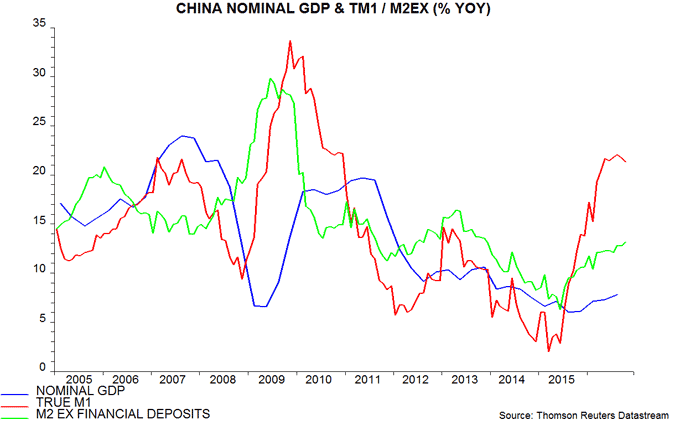
Rising growth of the two money measures since mid-2015 has been reflected in a pick-up in annual nominal GDP expansion in 2016. This pick-up should continue into early 2017, even assuming that annual true M1 growth peaked in August – the lead from money to nominal GDP expansion has been at least six months in recent years.
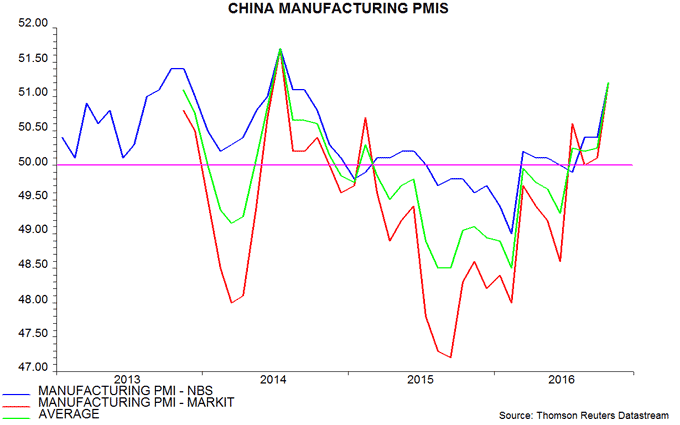
The second chart shows six-month changes in industrial output and the money measures expressed in real terms (i.e. deflated by consumer prices). Industrial output growth has picked up by less than was expected here on the basis of real money trends, partly reflecting economic “rebalancing” away from heavy industry. Strong October manufacturing PMIs, however, suggest that momentum will rise in late 2016 – third chart.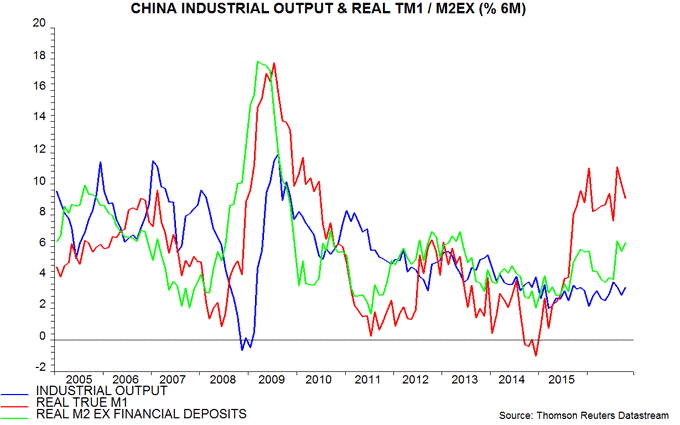
The recent further fall of the renminbi against the US dollar has prompted speculation that the authorities either desire a weaker exchange rate or have been unable to offset capital outflows. Measured against the PBoC’s currency basket, however, the renminbi has been broadly stable since mid-year, following a managed depreciation during the first half – fourth chart.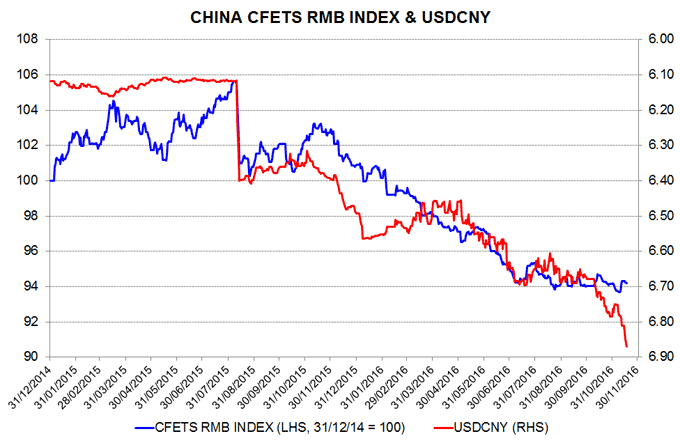
UK vacancies data upbeat, wage growth firmer
Amid heightened uncertainty about UK economic performance and prospects following the Brexit vote, a post in early August suggested an “Occam’s razor” approach of using vacancies data as a guide to current activity and narrow money trends to assess the outlook six to 12 months ahead. This resulted in a view that the economy would grow respectably in the third quarter, with momentum sustained into early 2017, at least.
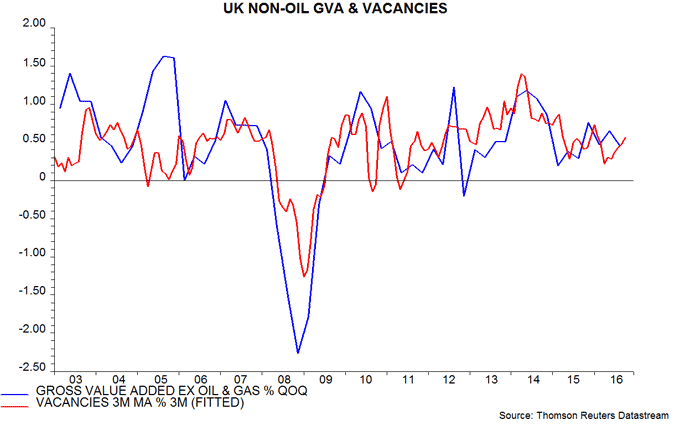
The Office for National Statistics (ONS) today released October vacancies data and the message remains positive. Indeed, three-month growth in the stock of vacancies, reported as a three-month moving average, rose to 1.6%, the fastest since February. This rate of increase is consistent with quarterly gross value added (GVA) growth of 0.5-0.6%, based on a simple model – see first chart. The model, admittedly, regularly goes “off track” but its fit is similar to that of models based on business survey evidence, such as the purchasing managers’ indices. The reason for emphasising the vacancies data in the wake of the Brexit vote was that business surveys were likely to be temporarily “infected” by emotion and uncertainty, as proved to be the case.
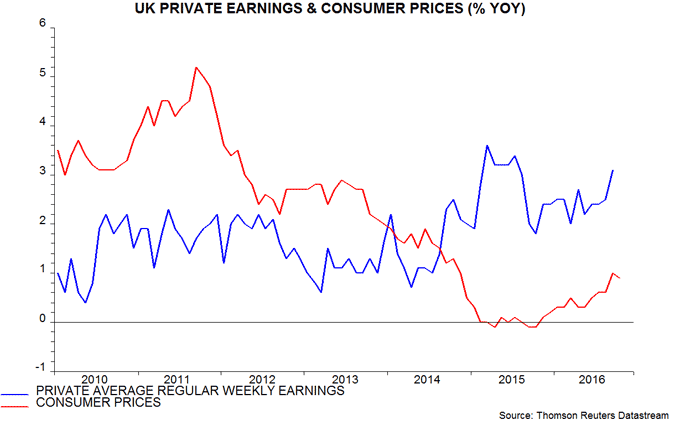
The ONS also reported that annual growth of private regular weekly earnings rose to 3.1% in September, the fastest since July 2015 – second chart. The monthly numbers can be volatile but wage pressures may be rising in response to a tight labour market and recovering consumer price inflation. The suggestion that earnings are keeping pace with prices is positive for near-term consumption prospects but increases concern that the coming inflation overshoot will be sustained – see yesterday’s post.
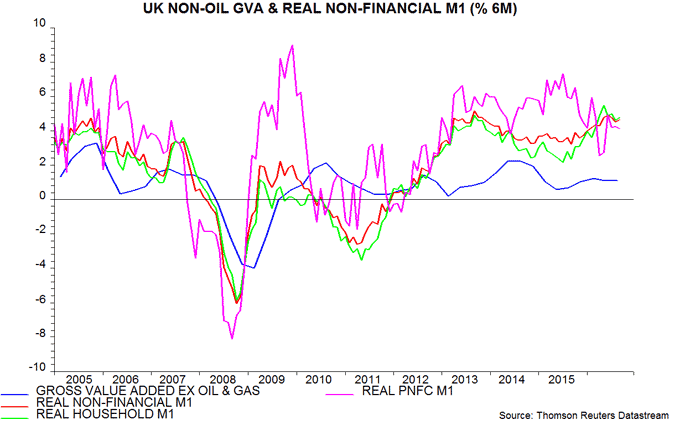
As previously discussed, six-month growth of real narrow money (i.e. non-financial M1 divided by consumer prices) has remained solid since the Brexit vote, consistent with the economy retaining respectable momentum through spring 2017, at least. There has, however, been a moderation in growth of holdings of private non-financial corporations (PNFCs) since last year, offset by an acceleration of household holdings – another reason for expecting economic expansion to remain consumption-led. The PNFC component sometimes leads the total (e.g. before the 2008-09 recession); a further significant slowdown would suggest that Brexit risks to investment spending are starting to crystallise.
UK inflation: prepare for lift-off
Annual consumer price inflation fell unexpectedly to 0.9% in October and could undershoot the Bank of England’s 1.25% forecast for the fourth quarter. Sadly, this does not warrant any change to the view that inflation will rise sharply in 2017, probably exceeding 3% during the course of the year. Currency and commodity price effects are still a significant net drag on inflation currently but should deliver a major boost in early 2017. Strong monetary growth and a tight labour market, meanwhile, suggest that upward pressure on inflation will be sustained over the medium term.
“Core” CPI inflation – excluding energy, food, alcohol and tobacco – declined to 1.2% in October, a five-month low, with significant downward contributions from clothing (reversing a September boost), games and toys, student tuition fees and hotels. Changes in core inflation in recent years have been positively correlated with swings in the rate of change of manufactured import prices, lagged by a year – see first chart. The annual import price change reached a low of -5% in November 2015 but had rebounded to 5% by September 2016, with a double-digit gain likely by early 2017, based on the current level of sterling. This suggests a rising trend in core inflation from end-2016 through late 2017, at least.
Headline CPI inflation is still below the core rate currently because of negative and neutral contributions respectively from food and energy prices. With sterling commodity prices, however, currently 40% above their level at the start of 2016, the headline / core gap will soon turn positive and may reach 1-2 percentage points later in 2017 – second chart.
Faster headline price rises are more likely to feed back into higher wage demands now than when inflation spiked in 2008 and 2011, because the labour market is much tighter than then. The percentage of CBI industrial firms reporting a shortage of skilled labour rose to its highest since 1989 in October – third chart. EU free movement will no longer act as an automatic safety valve to prevent labour market overheating.
The monetary backdrop, in addition, is more inflationary. Annual growth of broad money, as measured by non-financial M4, fell sharply during the 2008 inflation spike and was below 2% in 2011; it rose to 6.8% in September 2016, an eight-year high – fourth chart. Broad money velocity fell by 1.1% per annum (pa) on average over the five years to mid-2016. If this rate of decline were to continue, sustained money growth of 6.8% pa would imply nominal GDP expansion of more than 5.5% pa, in turn suggesting 3% plus inflation, assuming a potential output rise of no more than 2.5% pa.
Global reflation under way before US elections
Global monetary trends have been giving a reflationary message since early 2016. The US election results appear to have acted as a trigger for sceptical investors to adjust their portfolios in this direction. This adjustment probably has further to run.
Annual growth of global (i.e. G7 plus emerging E7) narrow money bottomed in mid-2015 and has vaulted higher since early 2016, with a September reading of 11.6% the equal highest (with August / September 2011) since 2009. Large movements in narrow money growth lead swings in nominal GDP expansion, which appears to have bottomed in the fourth quarter of 2015 – see first chart. The recent upswing in narrow money growth is the largest since 2008-09.
The positive narrow money signal has been confirmed by an upswing in a non-monetary global leading indicator derived from the OECD’s country leading indicators. Six-month growth of this measure rose further in September, according to data released this week – second chart.
An additional reason for the positive economic view here is an assessment that the three- to five-year US Kitchin stockbuilding cycle is at or close to a trough. Stocks were little changed in the third quarter and their ratio to final sales has fallen significantly – third chart. The upswing out of the last US Kitchin cycle trough in 2012 was associated with strong global equity markets, outperformance of “cyclical” stocks relative to “defensives”, and rising longer-term government bond yields.
The increase in yields in 2013 contributed to underperformance of emerging market assets, reflecting a vicious circle of capital outflows, tighter domestic monetary conditions and economic weakness. The E7 grouping, however, is leading the current growth upswing and narrow money trends are much stronger than in 2013, both in absolute terms and relative to the G7 – fourth chart. Another contrast is that commodity prices were soft in 2013 but are now strengthening, implying an income gain for some emerging economies.
Some commentary has suggested that rising US long-term yields and associated US dollar strength are squeezing global liquidity, threatening economic prospects. A steepening yield curve, however, normally signals an improving economic outlook and is particularly noteworthy when accompanied by strong monetary expansion. The slope of the yield curve is a component of several of the OECD’s country leading indicators, including the US, Japan and Germany. The recent steepening, therefore, may sustain the upswing in the global leading indicator tracked here.
The ratio of the MSCI World cyclical sectors index to the counterpart defensive sectors index has risen by 16% from a low reached in early July after the Brexit referendum, a larger gain than during the last global economic acceleration in 2012-13 – fifth chart. The fall into the July low, however, arguably partly reflected a false assessment of the implications of the UK vote, while the global growth / inflation outlook is judged here to be stronger now than in 2012-13. The cyclical / defensive relative rose by 45% during the 2009-11 economic upswing.

