Entries from November 1, 2016 - November 30, 2016
Eurozone money signal neutral, QE offset by capital outflow
Eurozone broad money M3 growth has been depressed by a record outflow of capital from the region over the past 12 months. Monetary trends, nevertheless, are consistent with respectable economic growth.
Annual M3 growth fell from 5.1% in September to 4.4% in October, the lowest since March 2015. Accelerating credit to the private sector and a rising government contribution, reflecting the ECB’s QE programme, have been pushing up on M3 growth recently but have been more than offset by a fall in banks’ net external assets – see first chart.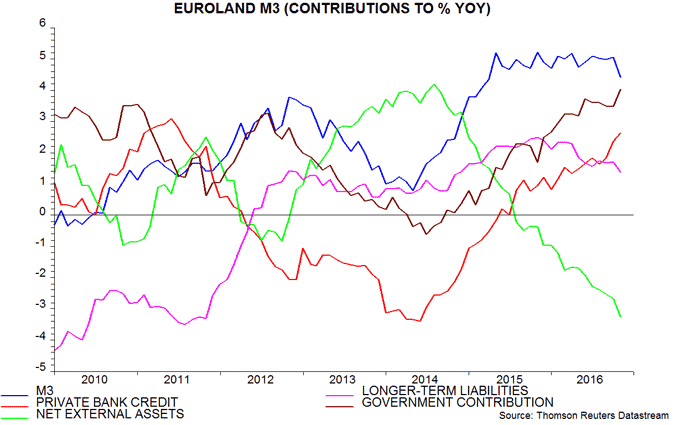
The change in banks’ net external assets is the counterpart of the balance of payments current and non-bank capital account. The net asset position declined by €351 billion in the 12 months to October despite a €337 billion current account surplus in the 12 months to September (the latest available month). This suggests a net outflow on the non-bank capital account of about €690 billion over the past year, equivalent to 6.5% of Eurozone annual GDP.
What explains the capital haemorrhage? It is tempting to blame fiscal / structural policy paralysis, banking sector woes and political uncertainty. QE, however, is likely to have been the main driver. Evidence from other countries that have conducted QE suggests that a large portion of liquidity created has flowed abroad. The domestic monetary impact has been small or even negligible, although QE may have contributed to stronger global broad money growth.
Does the M3 slowdown signal deteriorating economic prospects? Probably not. The forecasting approach here focuses on non-financial money, i.e. held by households and non-financial corporations. The headline M3 and M1 measures have been depressed by a fall in financial sector deposits, probably reflecting weaker demand for money due to low / negative rates, with no implication for spending in the economy. Annual growth of non-financial M3 was significantly stronger than that of M3 in October, at 5.2%, down from 5.7% in September. Annual non-financial M1 growth of 8.7% similarly exceeded headline M1 expansion of 7.9% – second chart.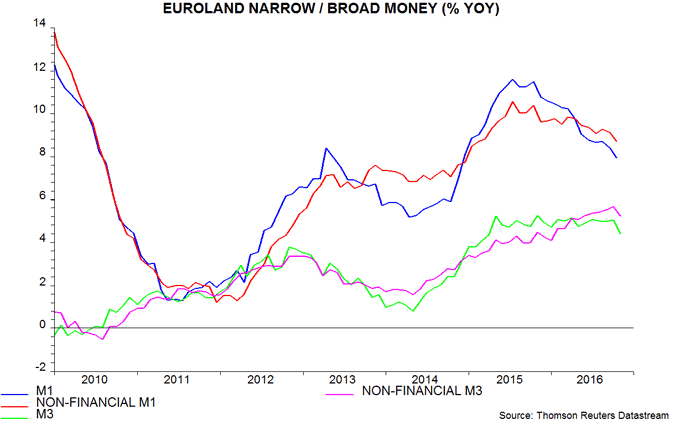
Six-month growth rates of real non-financial M1 / M3, admittedly, have declined notably since early 2016 – third chart. Both measures, however, are around the middle of their ranges since 2013, a period during which GDP growth has averaged about 1.5% annualised – above most estimates of potential. Economic performance in late 2016 / early 2017 may be boosted by a rise in net exports, reflecting global strength and a competitive exchange rate.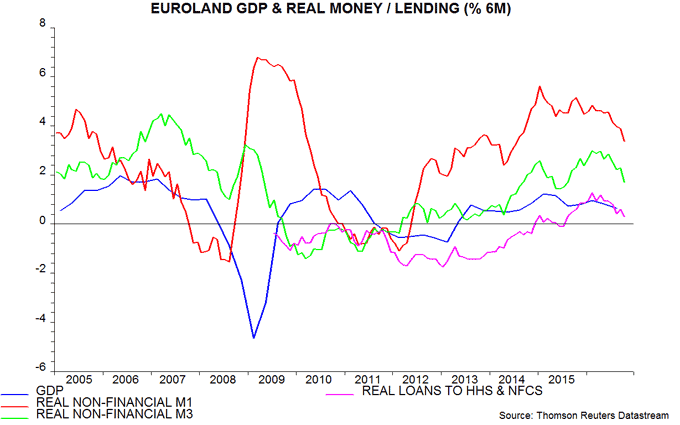
UK money trends still signalling economic strength
UK money trends remain solid, arguing against the consensus forecast of an economic slowdown in 2017. Narrow money holdings of both households and private non-financial corporations (PNFCs) are expanding robustly, suggesting that consumers plan to increase spending despite talk of a coming real wage squeeze, while businesses are not yet reining in expansion in response to Brexit uncertainty.
The preferred narrow and broad money measures here are non-financial M1 / M4, covering household and PNFC holdings but excluding volatile financial sector deposits, which are less relevant for assessing near-term spending prospects. Non-financial M1 rose by 0.7% in October, while non-financial M4 increased by 0.3%. Annual growth rates were 9.9% and 6.4% respectively, down from 10.1% and 6.8% in September but high by post-crisis standards.
Six-month growth rates of real (i.e. consumer price-adjusted) non-financial M1 / M4 have risen since mid 2015, with this pick-up subsequently reflected in faster economic expansion. The real money growth measures are below recent peaks but remain solid, suggesting that GDP / gross value added (GVA) will continue to rise at an annualised 2.0-2.5% pace – see first chart.
The sectoral breakdown is also reassuring. Six-month growth of real household M1 picked up strongly in early 2016, correctly signalling recent consumption buoyancy. It has moderated recently but remains consistent with respectable spending expansion. Corporate real M1 growth, by contrast, has rebounded from weakness in early 2016, suggesting that firms are revising up investment plans in response to stronger-than-expected economic expansion and favourable financing conditions, despite Brexit uncertainty – second chart.


UK nominal GDP accelerating in line with "monetarist" prediction
Annual growth of UK nominal (current-price) GDP increased further to 4.0% in the third quarter, according to preliminary ONS data, with monetary trends suggesting a further pick-up into early 2017, at least. The latest OBR Economic and fiscal outlook, for comparison, forecasts nominal GDP growth of only 2.8% in 2017.
Nominal GDP growth has risen since the third quarter of 2015, following increases in annual rates of change of narrow and broad money – as measured by non-financial M1 / M4 – from June and February 2015 respectively. Growth of both money measures continued to climb into September, with broad money expansion the fastest since 2008 – see chart. (October monetary data will be released on 29 November.)
Quarterly growth of constant-price GDP was left unrevised at 0.5% in the third quarter, against a suggestion here of an upgrade – see previous post. As expected on the basis of turnover data, services output rose further in September but the increase was moderated by a fall in financial services activities (not covered by the turnover survey), while July output was revised lower. The implied level of GDP in September, however, is 0.2% above the third-quarter average, creating a solid base for current-quarter growth.
The expenditure details show a 0.9% increase in business investment last quarter, consistent with resilient corporate narrow money trends. Consumer spending continued to drive overall expansion, rising by 0.7%. The ONS headlines refer to net trade adding 0.7 percentage points to quarterly growth but this is misleading: the improvement was entirely due to the balance of trade in non-monetary gold swinging from a deficit in the second quarter to a surplus in the third quarter, i.e. UK residents were net buyers of gold in the second quarter but sold in the third, perhaps partly reflecting profit-taking following sterling weakness. Adjusting for transactions in gold and other valuables, domestic demand contributed to 0.7 pp to third-quarter growth, with net trade subtracting 0.2 pp.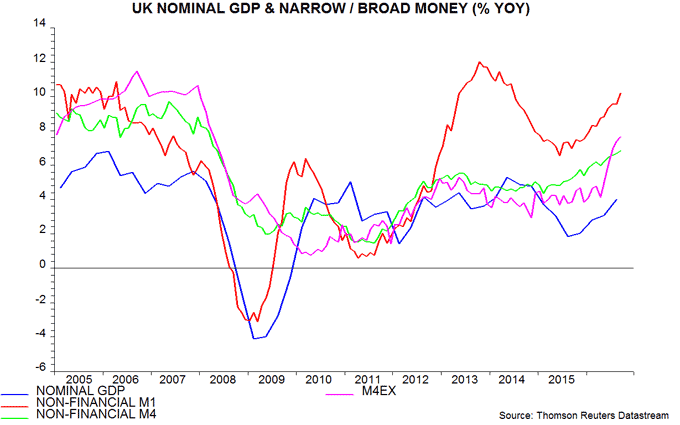
Global acceleration watch: OECD leading indicators
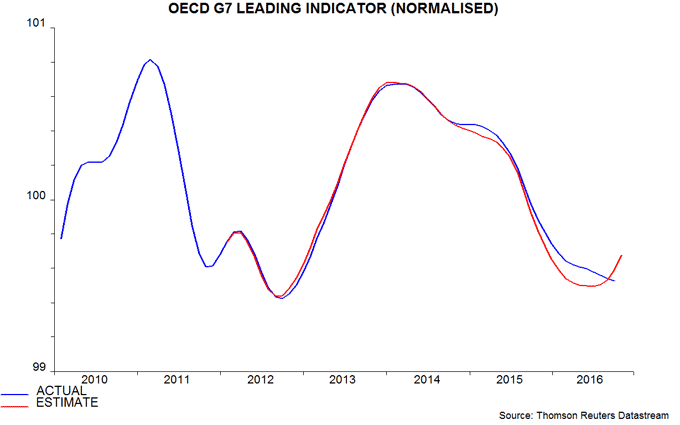
Many market participants monitor the OECD’s composite leading indicators for guidance on near-term economic prospects. October numbers to be released on 8 December are likely to be strong, providing further support for the forecast here – based on monetary trends – of a developing global economic boomlet.
The OECD presents its leading indicators in detrended form, meaning that a stable reading signals future economic growth in line with the estimated longer-run trend. As of September, its G7 leading indicator was falling gently, while indicators for China, India, Brazil and Russia were rising. The OECD interpreted these developments as signalling “stable growth momentum in the OECD area with growth gaining momentum in major emerging economies”.
The OECD’s calculations were replicated here in order to produce an October estimate of its G7 leading indicator, based on partial data*. The indicator appears to have risen strongly last month, while revisions may show that it has been increasing since June – see chart. Rather than “stable growth momentum”, therefore, the new data may signal above-trend and accelerating economic expansion.
Key drivers of the October increase and upward revision to earlier data include recent stronger business / consumer surveys, large increases in US housing starts and durable orders in October and financial market developments, i.e. rising stock markets and steepening yield curves.
*For example, additional data points are available for five of the seven components of the US leading indicator. Note that the October indicator readings take into account November data on the components, where available (e.g. US consumer sentiment).
UK Autumn Statement: Clarkson not Hammond?
The Chancellor delivered a somewhat racy Autumn Statement, belying his reputation as a fiscal hawk. Faced with a significant rise in projected borrowing due to a shortfall in tax receipts and lowered OBR growth forecasts, Mr Hammond nevertheless chose to announce “giveaways” amounting to 0.4% of GDP per annum by 2020-21. He also introduced surprisingly unambitious new fiscal rules that appear to give him scope to add up to a further 1.2% of GDP to the deficit in 2020-21, should he decide that the economy requires additional stimulus.
The centrepiece of the Statement, and the destination for most of the additional borrowing, is the new National Productivity Investment Fund, which will spend rising amounts on housing, transport, telecoms and R&D, reaching £7 billion by 2021-22, or 0.3% of GDP. Welfare measures absorb a further £2 billion in that year, reflecting the Government’s decision to backtrack on changes to personal independence payments and a small giveaway on universal credit. Tax changes were modest, with a rise in insurance premium tax and additional avoidance measures raising slightly more than the cost of freezing fuel duty for a sixth year.
The new fiscal mandate requires the government to reduce the structural or cyclically-adjusted deficit to below 2% of GDP by 2020-21 – significantly weaker than the previous requirement of an actual budget surplus in 2019-20 and beyond. The mandate is easily met on the OBR’s forecasts, showing a structural shortfall of 0.8% of GDP in 2020-21. The new supplementary target is for net debt to fall as a percentage of GDP in 2020-21 and is equally unlikely to constrain the Chancellor’s future room for manoeuvre, not least because an unwinding of the Bank of England’s term funding scheme is projected to cut the net debt ratio by 1.4 percentage points in that year.
The key judgement underlying today’s package was made by the OBR rather than the Chancellor – a forecast that the economy will grow by an average 1.9% per annum in the five years to 2020-21, only 0.2 percentage points below its Budget projection, despite Brexit. The OBR arguably gave Mr Hammond an easy ride on his first outing; it may well prove less accommodating in future assessments.
UK public finances: beware excessive pessimism
The consensus view is that the outlook for the UK public finances has deteriorated significantly since the Brexit vote. Rising nominal GDP growth, however, is supporting central government receipts, suggesting only a modest overshoot of the Office for Budget Responsibility’s March forecast of net borrowing of £55.5 billion in 2016-17. The OBR’s new fiscal forecasts in tomorrow’s Autumn Statement may be too pessimistic if they assume that nominal GDP will slow in 2017 and beyond.
October public finance numbers released today were better than expected, showing cumulative borrowing in the first seven months of 2016-17 £5.6 billion lower than in the same period of 2015-16. A continuation of this rate of improvement over the remaining five months would imply full-year borrowing of about £66 billion – above the £55.5 billion OBR forecast but below a consensus projection of £70.4 billion (according to the Treasury’s monthly survey of forecasters).
The rate of improvement, however, may pick up over the remainder of 2016-17. Central government taxes and national insurance contributions rose by 4.2% over April-October from a year before, below the OBR’s March forecast of a 5.5% increase in 2016-17 as a whole. This divergence may narrow or close as taxes / NICs benefit from recent faster nominal GDP expansion.
Annual growth of nominal GDP bottomed in the third quarter of 2015 and is likely to have risen further last quarter – data will be released on Friday. Taxes / NICs are starting to reflect this pick-up, with annual growth increasing to 4.7% in the three months to October – see first chart.
The OBR in March projected that nominal GDP growth would rise from 3.6% in 2016-17 to 4.0% in 2017-18, remaining around this level over the subsequent three years. If it follows the consensus (as it usually does), these numbers may be cut to 3.0-3.5% in the Autumn Statement. Monetary trends, however, support the March forecast or even faster growth in 2017-18 – see second chart and previous post. The OBR, therefore, may be overly pessimistic about prospects for receipts and, by extension, borrowing in tomorrow’s update.


