
Entries from May 1, 2019 - May 31, 2019
UK corporate money trends flashing red
 Simon Ward
 Post a Comment
A previous post noted that UK corporate narrow money trends were giving a recession warning. The signal has strengthened in April data released today, with the six-month change in real M1 holdings of private non-financial corporations (PNFCs) moving deeper into negative territory – see first chart.

Corporate money weakness is consistent with a squeeze on finances and suggests a faster decline in investment along with job cuts – now being signalled by vacancies data.
The six-month change reached similar levels in 2010-11, following which GDP slowed but did not contract. The global economic backdrop, however, is weaker now, while the negative impact of Brexit uncertainty may not be fully captured in the money numbers.
GDP, moreover, was still far below potential in 2010-11 – recessions usually occur only after the “output gap” has closed.
As previously explained, household narrow money resilience offers little reassurance, as it appears to reflect a portfolio switch out of mutual funds. A broad household savings aggregate encompassing M4 holdings, National Savings and mutual funds ("M4++") has barely grown in real terms over the last six months, suggesting a consumer spending slowdown – second chart.

Labour market watch: job openings rolling over
Last week’s flash PMIs for May confirmed that economic weakness has spread to the US, and from manufacturing to services. The next stage of the downswing, according to the analysis here, will be a crumbling of labour market resilience, which – together with slowing inflation – will add to pressure for central bank policy easing. This is the first of a series of short posts focusing on incoming labour market news.
A previous post noted that UK vacancies (three-month moving average) fell for a third consecutive month in April, signalling a likely decline in employee numbers. The first chart shows that measures of job openings / vacancies rose across economies into early 2018 but are now flatlining or falling across the board.

A drop in German vacancies in May was accompanied by a surprise rise in unemployment – even after adjusting for a reporting change. German aggregate hours worked, meanwhile, fell in the first quarter – second chart.

Euroland money trends suggesting relative resilience
Euroland money growth was little changed in April and continues to give a hopeful message for economic prospects. Global weakness and a reversal of UK pre-Brexit stockbuilding, however, may delay a recovery in momentum until late 2019 / 2020.
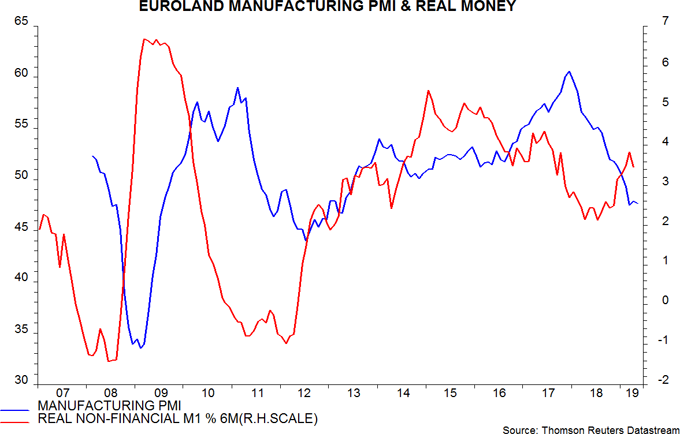
Six-month growth rates of real narrow and broad money, as measured by non-financial M1 / M3, edged lower in April but remain well above lows reached in July and March 2018 respectively. The rise from those lows has already been reflected in a small revival in two-quarter GDP momentum – see first chart.

Euroland real narrow money growth, unusually for recent years, is above levels in both the US and China.
In addition, the Kitchin inventory cycle downswing may be further advanced in Euroland relative to other regions. In Germany, in particular, inventories subtracted 0.3 percentage points (pp) from the quarterly change in GDP in the first quarter, following a 0.5 pp drag in the fourth quarter. US inventories, by contrast, contributed positively to GDP growth in the latest three quarters, by a cumulative 0.8 pp.
The recovery in real money growth suggests that the manufacturing PMI is at or close to a bottom – second chart.
The main reason for caution is the likelihood of further US / Chinese economic weakness depressing exports and, by extension, business investment. Exports, moreover, have been supported by UK Brexit-related stockpiling, which is now reversing.
Current conditions may be the mirror-image of those in 2016-17. Real narrow money growth moderated over this period but US / Chinese economic strength boosted exports / investment and delayed a peak in the manufacturing PMI until December 2017. Global weakness may now postpone a Euroland economic recovery until 2020.
Equities / cash switching rules: an update
Previous posts (last one here) discussed two rules for switching between global equities and US dollar cash based on monetary signals. The rules are currently giving opposite recommendations. Historically, the opportunity cost of holding cash has been low, on average, under such circumstances.
The simple idea underlying the rules is that “high” (to be defined below) global money growth is likely to be associated with rising demand for equities and other financial assets, with corresponding upward pressure on prices. Conversely, low or falling money growth may signal selling and downward pressure.
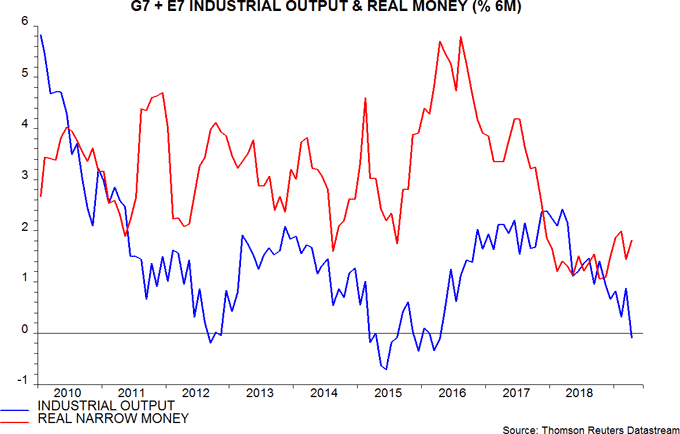
The first rule generates positive or negative signals by comparing six-month rates of change of global* real narrow money and industrial output. A positive differential suggests that money holdings are rising faster than needed to support economic expansion, implying a surplus to be invested in markets.
The second rule recommends equities unless G7 annual real narrow money growth falls below 3% – its average from 1970 until the 2008-09 recession / crisis.
The rules take into account data reporting lags and switching takes place at end-month. The first rule incorporates a three-month lag, e.g. the recommended asset allocation for May, implemented at end-April, depends on monetary / industrial output data for February. The lag is two months for the second rule because it relies only on monetary data, which in most countries are available by the end of the following month.
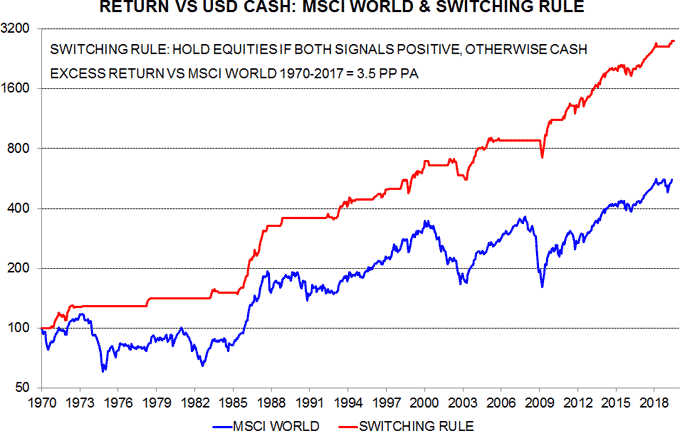
Both rules would have outperformed equities significantly over the long term – unsurprisingly, given that their formulation was informed by historical evidence.
The second rule has performed favourably in 2018-19. On an end-month basis, global equity markets, as measured by the MSCI World index in US dollars, peaked in January 2018. Equities underperformed dollar cash by 1.3% between January 2018 and April 2019 and suffered a maximum relative drawdown of 14.6% in December 2018. The second rule outperformed cash by 0.8% over this period, with a maximum drawdown of 6.4%.
The first rule, by contrast, has been disappointing. It underperformed cash by 3.6% over the period, with a maximum drawdown of 10.4%, i.e. only modestly smaller than for holding equities throughout.
This disappointing performance reflects the longer reporting lag incorporated in the rule, which resulted in several “whipsaws”. If the rule could have been implemented with a two-month lag, as with the second rule, it would have performed impressively, outperforming cash by 21.5% between January 2018 and April 2019, with no drawdown relative to the January starting point.
This raises the possibility of trying to reduce the lag to two months by estimating global industrial output for the latest month. Countries accounting for a combined weight of about two-thirds in the output aggregate release data by the end of the following month, so such an approach is feasible and likely to be reliable in most months.
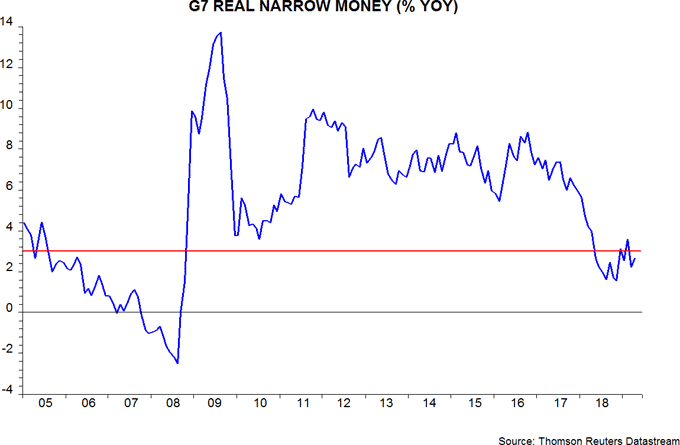
What are the current recommendations of the two rules? The second rule switched from equities into cash at end-April because G7 annual real narrow money growth fell back below 3% in March – see first chart. Available data suggest that growth remained below 3% in April, so the rule is likely to recommend cash again at end-May.
The gap between six-month rates of change of global real narrow money and industrial output was positive in February and March, and is likely to have widened further in April, based on US / Chinese output data – second chart. The first rule, therefore, recommended equities at end-April and will do so again at end-May – regardless of whether the recommendation is based on actual March numbers or April estimates.
Historically, the excess return on equities relative to cash averaged only 0.9% per annum when the two rules gave conflicting recommendations, compared with 16.3% when both recommended equities. The opportunity cost of holding cash under such circumstances, in other words, was modest, on average.
It is, of course, possible to combine the two approaches in a single “conservative” rule that recommends equities only if both monetary inputs are positive. The long-term return on such a rule would have been only marginally lower than for the two individual rules, with a smaller maximum drawdown – the third chart shows a comparison with buy-and-hold. This rule outperformed cash by 1.8% between January 2018 and April 2019, with a maximum drawdown of 4.2%.
*”Global” = G7 plus emerging E7. G7-only data used before 2005.
Global narrow money growth still weak
Global six-month real narrow money growth appears to have recovered partially in April after a March relapse but remains weak by post-GFC standards – a much bigger pick-up is needed to signal an economic recovery, which, in any case, is unlikely before early 2020 at the earliest.
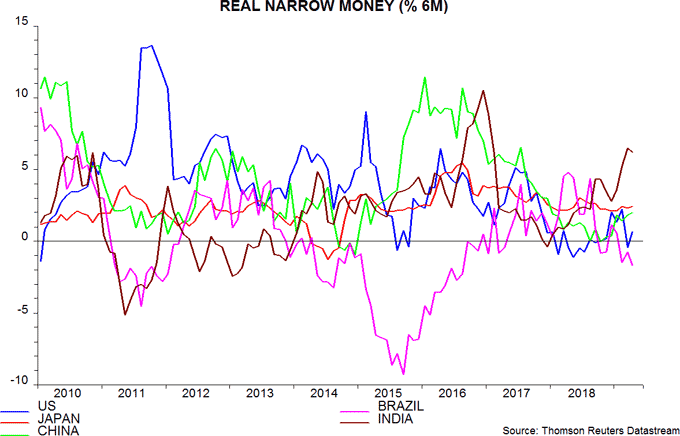
The US, Japan, China, Brazil and India have released April monetary data, together accounting for two-thirds of the G7 plus E7 aggregate tracked here. Assuming unchanged growth in other countries, and incorporating near-complete consumer price data, six-month real narrow money growth is estimated to have risen from 1.4% to 1.8% – see chart.

The April estimate compares with a low of 1.1% in October 2018 but is beneath the level in all but two months over 2010-17. The judgement here remains that a rise to 3% is needed to signal an economic recovery – a move through 3% occurred before all seven previous rebounds in global economic momentum since the 2008-09 recession.
The April increase mainly reflected a recovery in US six-month real money momentum, which had turned negative in March. Chinese and Japanese growth was up slightly on the month, while Indian (strong) and Brazilian (weak) momentum softened – second chart. The final April number will depend importantly on Euroland money data released on 28 May.
As previously discussed, US and Chinese April industrial output data released last week suggest that six-month G7 plus E7 momentum turned negative in April – the final data point in the first chart assumes that output in the other countries rose by 0.5% month-on-month.
Current global industrial weakness is comparable to 2011-12 and 2015-16. The view here has been that this downturn would be the most severe since the 2008-09 recession; with the stockbuilding cycle downswing only now reaching its maximum intensity, this forecast appears on track.
US C&I loans confirming stocks cycle downswing
Recent US industrial output weakness is judged here to be partly due to a downswing in the Kitchin stockbuilding cycle – firms are cutting production to clear an overhang of inventories. Data on banks’ commercial and industrial (C&I) loans are consistent with this story.
The three economic cycles – stockbuilding, business investment and housing – each drive an associated credit cycle. The stockbuilding cycle shows up in C&I loans, which play a key role in financing inventories.
Three-month growth of C&I loans surged at end-2018, consistent with strong stockbuilding in the fourth-quarter GDP accounts. Growth, however, fell sharply through April, with loans contracting in the latest month – see first chart.

The second chart shows the contribution of stockbuilding to annual GDP growth along with the annual change in three-month C&I loan momentum. The C&I loan series is quarterly, with numbers referring to the final month of each quarter except for the last data point, which is for April. The suggestion from the C&I loan data is that the stocks cycle is now acting as a significant drag on economic expansion.

