Entries from May 1, 2017 - May 31, 2017
Chinese money growth slowing but still respectable
Chinese nominal and real economic growth may be starting to moderate, consistent with a slowdown in monetary expansion since the second half of 2016. Money trends, however, remain respectable by historical standards, suggesting that economic weakness will be contained.
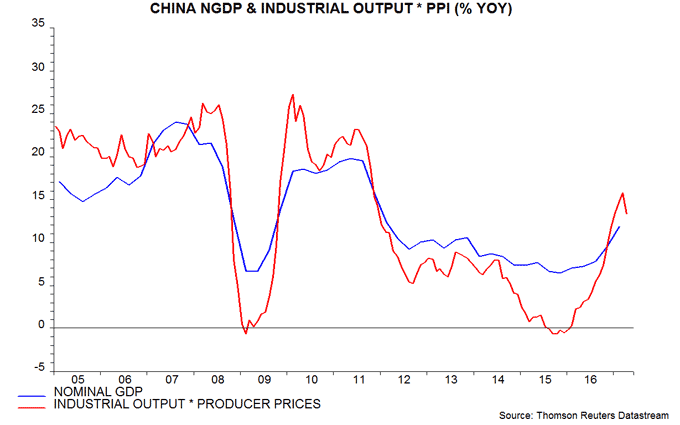
Annual industrial output growth fell back from 7.6% in March to 6.5% in April, while producer price inflation moderated from 7.6% to 6.4%. The product of industrial output and producer prices is a rough guide to nominal GDP, annual growth of which is likely to have peaked in the first quarter of 2017 – see first chart.
A topping out of nominal GDP growth in the first half of 2017 had been suggested by slower monetary expansion in late 2016. Annual growth of the preferred narrow and broad money measures here peaked in August and November 2016 respectively – second chart*.
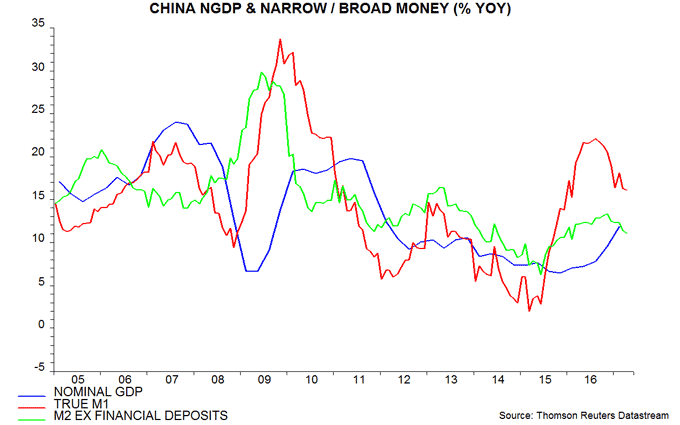
The money growth measures eased further in April but have retraced less than one-third of their rise over 2015-16. The monetary backdrop, therefore, remains considerably more expansionary than in late 2014 / early 2015.
The third chart shows six-month growth rates of industrial output, real narrow money and real total social financing (real = deflated by consumer prices). Real narrow money growth has fallen significantly since August 2016 but remains above its average since 2010. Real financing growth, meanwhile, has only recently edged lower.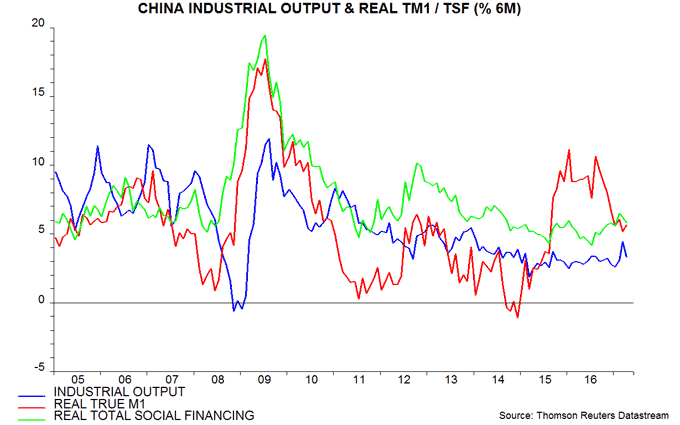
Investors are concerned that a recent policy-driven tightening of money market conditions, reflected in significantly higher interest rates, will cause the economy to slow sharply over the summer. This change, however, will take several months to feed through to money growth, which typically leads activity by six to 12 months, suggesting that the negative impact will be delayed until late 2017. The PBoC, moreover, may act to temper the recent squeeze.
Interest rates on bank lending edged up in the first quarter but remained well down from 2014-15, according to just-released PBoC data – fourth chart.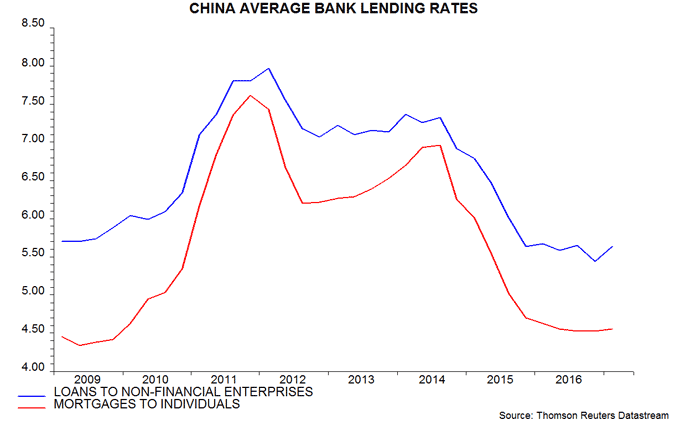
Annual growth of private fixed asset investment in value terms fell to a four-month low in April but weakness is likely to prove temporary, with strong growth of profits and enterprise bank deposits continuing to give a positive signal – fifth chart.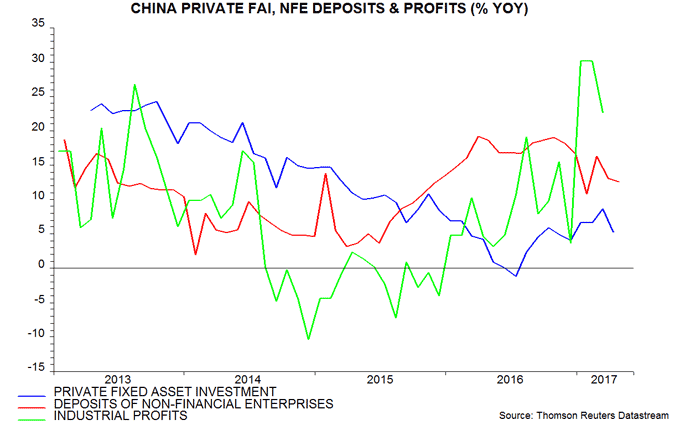
*Narrow money = “true” M1 = official M1 plus household demand / temporary deposits (relevant for assessing consumer spending prospects). Broad money = M2 minus financial sector deposits (volatile and unrelated to economic prospects).
Will bank credit easing force faster Fed tightening?
Slow US economic growth over the winter reflected a weakening of money and credit trends from summer 2016. This weakening was probably related to money market fund reforms, which raised banks’ funding costs and tightened the supply of credit. The negative impact of these reforms may be starting to fade, with money trends and credit conditions showing signs of improvement. This could herald economic reacceleration later in 2017.
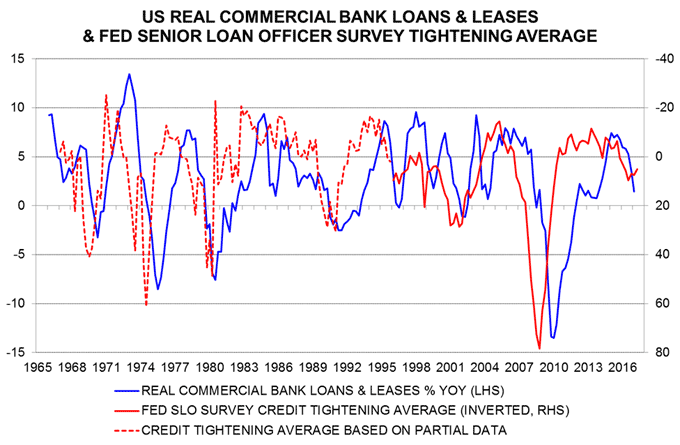
The Fed’s April survey of senior loan officers, released yesterday, reported a fall in the net percentages of banks tightening credit standards across most loan categories, with the exception of commercial real estate. An average of the net percentages fell to its lowest level since January 2016, having peaked in July – see first chart.

The rise in the average tightening balance into last summer preceded a sharp slowdown in commercial bank loans and leases in late 2016 / early 2017, in line with the historical inverse correlation between the average and subsequent real credit growth – second chart.
Lending weakness was accompanied by a similar slowdown in narrow money and was followed by sub-consensus GDP growth in the fourth quarter of 2016 and first quarter of 2017, as discussed in Friday’s post.
Why did money and credit trends weaken? The view here is that changes to money market fund regulations played an important role by discouraging funds from investing in private sector securities, including bank paper. This pushed up banks’ funding costs, causing them to tighten credit supply. The change in credit conditions probably disrupted some spending plans, in turn causing the demand for narrow money to weaken.
The negative funding cost effect, however, may be fading. The yield spread between three-month financial commercial paper (CP) and Treasury bills rose steadily in advance of the October 2016 implementation date for the money market fund reforms, peaking the month before. It has since retraced two-thirds of the 2015-16 increase. The two-year swap spread followed the CP spread higher but is also now in retreat – third chart.

The modest decline in the average tightening balance in the latest Fed loan officer survey suggests that easier funding conditions are starting to affect banks’ lending behaviour. As noted in Friday’s post, narrow money trends are also showing signs of improvement. The evidence so far is tentative but these developments could be consistent with stronger economic growth in late 2017.
Bank credit tightening in 2016 capped economic strength, resulting in the Fed raising interest rates by less than expected. A reversal of the effect over the remainder of 2017 could force the Fed to step up rate hikes. Such a scenario would be negative for Treasuries and, probably, equities.
Is US money growth reviving?
US GDP growth undershot consensus expectations in the fourth quarter of 2016 and first quarter of 2017, as had been signalled by real narrow money trends last summer. Real money growth may be starting to recover but recent weakness suggests that a significant rebound in economic momentum will be delayed until late 2017.
As discussed in previous posts, turning points in six-month growth of real (inflation-adjusted) narrow money growth have consistently led peaks and troughs in two-quarter GDP expansion in recent years. The labels in the first chart pair up turning points in the two series. The consensus was bullish about economic prospects last autumn but six-month real money expansion had peaked in April 2016 and was falling sharply, signalling likely disappointment. GDP momentum duly slowed markedly in the fourth and first quarters.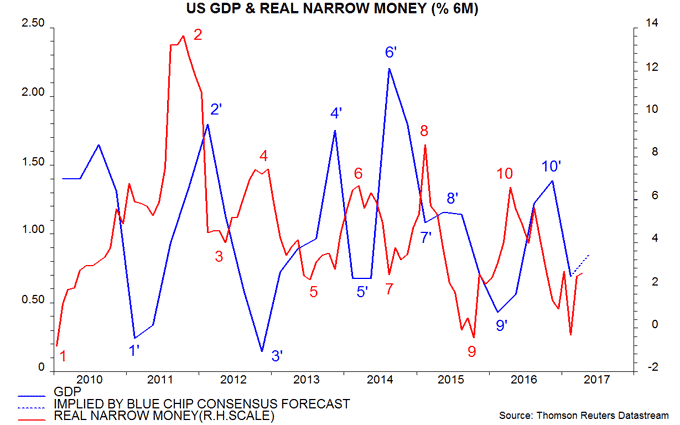
The consensus claims that seasonal adjustment problems and other “special” factors artificially depressed the first-quarter result. The Blue Chip consensus forecast is for quarterly annualised GDP growth to recover from 0.7% in the first quarter to 2.7% in the second. This would still leave two-quarter GDP expansion significantly lower than in the third and fourth quarters of 2016 – first chart.
Six-month real narrow money growth bottomed in February, recovering modestly in March and April – the last data point in the chart is an April estimate based on weekly data through 24 April and an assumed 0.2% monthly rise in consumer prices. The lead time between real money growth and GDP growth has averaged about six months recently, suggesting that economic momentum will start to revive at the end of the third quarter.
A further recovery in real narrow money growth is needed to “confirm” this scenario. The forecasting approach here uses monetary data to assess economic prospects but does not attempt to predict monetary trends, since there is no reliable method for doing so. Several recent developments, however, are consistent with a real money revival.
First, recent commodity price weakness is likely to result in a slowdown in six-month consumer price inflation, implying a rise in real money expansion assuming that nominal growth is stable – second chart.
Secondly, the monetary base has sometimes led narrow money in recent years and has recovered significantly so far in 2017 after contracting in late 2016 – third chart. This contraction reflected a rise in the Treasury’s balance at the Fed and greater use of the Fed’s reverse repo programme, both of which have reversed in 2017.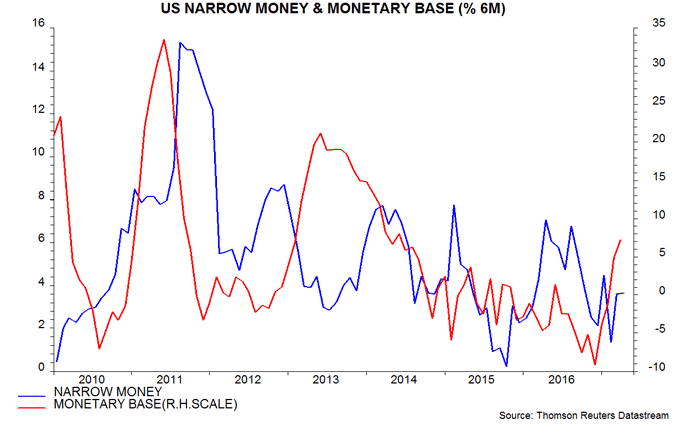
Thirdly, narrow money growth has been loosely correlated, inversely, with the two-year swap spread, with the spread sometimes leading – fourth chart. The spread has fallen recently, consistent with the upturn in money expansion.
A further recovery in real narrow money growth would suggest a stronger economy in late 2017. Treasury yields could move higher in anticipation of this prospect and as upward pressure on wage growth keeps the Fed on a tightening tack.
UK money trends signalling H2 economic slowdown
Soft UK GDP growth in the first quarter of 2017 partly reflected pay-back for a strong fourth quarter and a recovery seems likely in the current quarter. Monetary trends, however, have deteriorated significantly since the autumn, suggesting notably weaker second-half economic performance.
The preliminary estimate of a 0.3% rise in GDP in the first quarter released last week was in line with the suggestion from monthly data – see previous post. The preference here is to focus on six-month or two-quarter changes to assess trends in economic series. The weak first-quarter GDP rise followed a 0.7% fourth-quarter gain, which could be revised higher later this month, based on recent services turnover data. Growth across the two quarters, therefore, is currently estimated at 1.0%, or 1.9% at an annualised rate – faster than in the US (1.4%) and the same as in Euroland.
This solid performance was signalled by monetary trends – six-month growth of real (i.e. inflation-adjusted) narrow and broad money remained elevated through September / October 2016 and typically leads economic momentum by six to 12 months. On this basis, economic news may remain reasonably positive in the current quarter, with GDP growth recovering from the first-quarter disappointment.
Real money measures, however, slowed sharply around year-end, reflecting both lower nominal growth and faster inflation. March numbers released today were respectable in month-on-month terms but failed to reverse the deteriorating trend. The preferred narrow and broad aggregates here are non-financial M1 and non-financial M4, comprising money holdings of households and private non-financial corporations (PNFCs). Six-month growth rates of these aggregates, deflated by consumer prices (seasonally adjusted), were the weakest since 2011-12 – see first chart.
The real money measures are not yet contracting, as they did before the 2011-12 “double dip” scare. The fall in six-month growth, however, has been comparable in scale to the 2010-11 decline. GDP expansion averaged only 1.3% at an annualised rate in the two years to end-2012 – similar sluggishness may be in prospect unless monetary trends revive.
Annual growth of nominal non-financial M1 and non-financial M4 fell to 8.5% and 5.2% respectively in March, suggesting that annual nominal GDP expansion will moderate later in 2017 – second chart. Money trends are now notably weaker in the UK than Euroland, where annual growth of non-financial M1 and non-financial M3 rose further to 10.1% and 6.1% respectively in March – see previous post.
Annual growth of the Bank of England’s M4ex measure is stronger than that of the non-financial M4 aggregate tracked here, at 6.7% in March – second chart. M4ex continues to be inflated by a rapid rise in money holdings (and bank borrowing) of non-bank financial institutions, excluding intermediaries (i.e. insurance companies and pension funds, other fund managers and securities dealers). Such holdings increased by 16.4% in the year to March but have little if any implication for near-term economic prospects.
The third chart breaks out household and corporate real narrow money growth. The household component is weaker, consistent with a consumption-led economic slowdown.
The MPC is in a dilemma of its own making. Inflation is on course to rise significantly in 2017-18 in lagged response to monetary acceleration in 2015-16. The MPC should have leant against this pick-up by tightening policy in 2016 – the post-Brexit-vote easing was badly misjudged. It will be reluctant to correct this mistake against a backdrop of slowing economic momentum but inaction risks encouraging further sterling selling and entrenching higher inflation.

