
Entries from May 1, 2017 - May 31, 2017
UK real money growth at 5+ year low
 Simon Ward
 Post a Comment
The UK narrow and broad money measures tracked here posted respectable monthly rises in April but their six-month growth rates remain much lower than last autumn. With six-month consumer price inflation rising further in April, real-terms growth continued to subside, to its lowest since 2011-12. GDP growth will probably rebound in the second quarter but these trends suggest a significant slowdown during the second half. Household money growth has fallen by more than corporate growth, consistent with consumer-led weakness.
The narrow non-financial M1 aggregate rose by 0.7% in April but six-month growth edged down further to 3.2% – the lowest since 2014 and down from 5.2% in October 2016. The broader non-financial M4 measure increased by 0.5% in April, while six-month growth recovered slightly, though is also much lower than last autumn – see first chart.
Real money trends have been further squeezed by a sharp rise in the six-month rate of change of consumer prices (seasonally adjusted), which reached 1.9% in April, or 3.8% annualised.
Six-month growth rates of real non-financial M1 and non-financial M4 in April were, therefore, the weakest since 2012 and 2011 respectively – second chart.
The third chart shows real non-financial M1 growth broken down between households and private non-financial corporations (PNFCs). Household growth is weaker, consistent with a consumer-led economic slowdown. A recent uptick in PNFC growth is reassuring, suggesting that companies are still planning to expand investment and employment. (PNFC real narrow money has contracted before recessions historically.)
The focus here is on non-financial aggregates because financial sector money holdings contain little information about near-term prospects for spending on goods and services, and are often distorted by special factors. The Bank of England’s M4ex broad money measure rose by 7.3% in the year to April, outpacing a 5.4% increase in non-financial M4, reflecting strong growth in deposits held by insurance companies and pension funds, other fund managers and securities dealers. Part of this deposit rise may be connected with the implementation of liability-driven investment strategies by or for pension funds, with no economic implications. In addition, institutions may have switched out of Treasury bills and repos with the Debt Management Office (DMO) into bank deposits, i.e. M4ex overstates the growth of their total liquid assets. The stock of Treasury bills and “other central government debt” (mainly DMO repos) held by the private sector fell by £23 billion in the year to April.
The old M4 measure is even stronger than M4ex, rising by 8.2% in the year to April, reflecting a surge in deposits from “central clearing counterparties” – these increased by £56 billion, equivalent to 2.6% of M4, in the latest 12 months. Such deposits mostly represent indirect interbank lending and are unrelated to economic activity. Analysts focusing on M4ex or M4 are liable to overestimate economic prospects.
Euroland money trends signalling steady growth
The consensus has become more bullish about Eurozone economic prospects but real money trends are stable, suggesting that GDP will continue to expand at its recent pace of 1.75-2.0% per annum. Country detail shows that French overnight deposits are growing strongly, which may herald post-election economic acceleration. US real narrow money expansion, meanwhile, is catching up with and may soon exceed the Eurozone pace, cautioning against extrapolating recent Eurozone GDP growth outperformance.
The preferred narrow and broad monetary aggregates here are non-financial M1 / M3, which cover holdings of households and non-financial corporations, omitting volatile financial sector deposits. Six-month growth of real (i.e. inflation-adjusted) non-financial M1 edged down in April but remains slightly above its average over 2014-16 – see first chart. Real non-financial M3 growth is slightly below its corresponding average. GDP expanded at an average annualised rate of 1.9% over the 10 quarters from the third quarter of 2014 to the first quarter of 2017. A similar pace of growth, therefore, seems likely over the remainder of 2017.
Hopes of faster growth have been raised by recent strong purchasing managers’ survey results – the survey’s compiler, for example, claims that the flash May composite activity reading is consistent with a quarterly GDP increase of 0.6-0.7%, i.e. 2.4-2.8% annualised. This buoyancy, however, may partly reflect a temporary sentiment boost from the French presidential election result. The new orders component of the survey was less bullish than the headline activity series, falling to a four-month low.
M1 comprises currency and overnight deposits. A country breakdown is available for the latter and shows a further pick-up in French real deposit growth in April – second chart. A positive interpretation is that households and firms increased their holdings of narrow money in anticipation of boosting spending after the election. An alternative possibility, however, is that money was shifted into overnight accounts as a precaution to enable an immediate transfer out of the country in the event of a negative result.
US six-month real narrow money growth fell well beneath the Eurozone level in late 2016, casting doubt on the consensus forecast at the time of US relative economic strength. As previously discussed, US money and credit trends are now recovering and the real narrow money growth gap may have almost closed in May, based on weekly US data and assuming stable Eurozone expansion – third chart. With the consensus now bullish about Eurozone prospects, US economic news is more likely to surprise positively later in 2017.
UK GDP slowdown exaggerated but prospects fading
UK monetary trends have been signalling an economic slowdown in the second half of 2017. Today’s downward revision to quarterly GDP growth in the first quarter to only 0.2% raises the question of whether the slowdown has already arrived. The assessment here is that first-quarter weakness partly represented payback for solid performance during the second half of 2016 and quarterly growth is likely to bounce back in the second quarter before fading later in the year.
The analytical approach here focuses on six-month or two-quarter changes to assess trends in economic series, on the basis that this reduces noise while still allowing timely identification of turning points. GDP rose by 0.85%, or 1.7% at an annualised rate, in the fourth and first quarters combined. Excluding oil and gas extraction, output grew by an annualised 1.9% – equal to or above estimates of potential economic expansion*.
This respectable performance was signalled by monetary trends in the first half of 2016. Six-month growth of real narrow money – as measured by non-financial M1 deflated by consumer prices – peaked in June 2016 and remained elevated through October. Allowing for a typical nine-month lead, this suggested that economic growth would hold up through summer 2017. Real money, however, slowed sharply in late 2016 / early 2017, warning of economic weakness in late 2017 – see first chart.
The monetary forecast, therefore, implies a bounce-back in quarterly growth in the second quarter. The expenditure breakdown for the first quarter is consistent with this expectation. Domestic demand – adjusted to exclude the net acquisition of gold and other valuables – rose by 0.8% on the quarter, with a slowdown in household consumption expansion (from 0.7% to 0.3%) offset by faster growth of government consumption (0.8%) and fixed investment (1.2%). GDP expansion was depressed by a fall in net exports, which may rebound in the current quarter, partly reflecting solid global demand.
Nominal aggregates, meanwhile, continue to rise strongly, as earlier monetary strength feeds through to higher inflation. Annual growth of nominal GDP moderated to 4.4% in the first quarter but annual growth of nominal gross value added** (GVA) rose to 5.1%, the fastest since 2014 – second chart. Assuming potential economic expansion of no more than 2% per annum, nominal GDP / GVA growth needs to be limited to about 4% to be consistent with the 2% inflation target. Money trends suggest that growth is at or close to a peak.
The inflation drag on consumer spending has been moderated by faster expansion of aggregate employee incomes, reflecting modestly higher average earnings growth and resilient employment trends. Annual growth of employee compensation rose to 4.3% in the first quarter, the most since 2013 and compared with a 2.1% annual increase in the price deflator for household consumption. Real compensation, by contrast, contracted during the last inflation upsurge in 2010-11; consumer spending, however, was cushioned by a fall in the saving ratio from a high post-recession level – third chart.
*2017 potential growth estimates: OBR 1.9%, IMF 1.8%, EU Commission 1.6%, OECD 1.5%.
**GVA excludes indirect taxes and subsidies.
US money / credit trends improving
A recent post argued that changes to US money market fund regulations in 2016 had a stifling impact on money and credit growth. The post suggested that this effect was starting to reverse, implying improving economic prospects for late 2017. Incoming evidence supports this hypothesis. The Fed may have to step up policy tightening to offset commercial bank-led monetary loosening.
The regulatory changes resulted in money funds switching out of bank deposits and open market paper into Treasury and agency securities. The contention is that this portfolio shift boosted banks’ funding costs, leading them to reduce credit supply, causing a slowdown in money / lending and weaker spending. Money funds reduced their holdings of time deposits and open market paper by $583 billion during the last three quarters of 2016 while buying $431 billion of Treasury and agency securities, according to the Fed’s Z.1 financial accounts.
The yield spread between three-month financial commercial paper and Treasury bills rose from an average of 9 basis points (bp) in 2014 to a peak of 46 bp in September 2016 ahead of the October implementation of the new regulations. The spread, however, has fallen sharply in 2017, averaging 16 bp so far in May. The LIBOR / overnight indexed swap spread has behaved similarly – see first chart. This suggests that money funds had completed their portfolio adjustment by late 2016 and investment flows have normalised in 2017 (the Z.1 accounts for the first quarter will be released in early June).
The fall in funding costs should, if the hypothesis is correct, boost credit supply and encourage spending. The latest money / lending data are consistent with this story. Three-month growth of narrow money has picked up from a low in December 2016, while three-month growth of commercial bank loans and leases appears to have bottomed in March – second chart*.
Bank credit tightening in 2016 capped economic strength, resulting in the Fed raising interest rates by less than expected. A reversal of the effect over the remainder of 2017 could require additional Fed tightening to prevent economic overheating. Such a scenario would suggest renewed upward pressure on Treasury yields and, possibly, the US dollar.
*Incorporates May estimates based on weekly data through 8-10 May.
Global slowdown under way, latest money data slightly better
The view here since late 2016 has been that global economic momentum would slow from a peak in spring 2017. The latest monetary information suggests a renewed acceleration from late 2017, although this requires additional data confirmation. The near-term slowdown is not expected to reverse recent labour market tightening so is unlikely to deflect the Fed and other central banks from continuing to rein back stimulus. This suggests a difficult backdrop for markets.
Based on partial data, six-month growth of global industrial output is likely to have risen further in April to its highest level since 2014 (“global” = G7 plus “E7” large emerging economies). Growth may decline in May, reflecting an unfavourable base effect from a large monthly output rise in November 2016. An April peak in six-month growth would be consistent with global real narrow money trends: six-month real money expansion peaked in August 2016 and has led output growth turning points by an average of nine months historically – see first chart.
Real money growth, adjusted to smooth the effect of India’s demonetisation programme, fell into February 2017, suggesting that the economic slowdown will extend into late 2017. It recovered, however, in March, with partial April data indicating a further increase. If confirmed and followed by a third successive rise in May, the view of six-month-ahead economic prospects here will shift from downbeat back to upbeat.
Markets are unlikely to start discounting a year-end pick-up for several more months. Softer economic and earnings news may dominate near term. The prospect of a summer slowdown has been confirmed by the global leading indicator tracked here, one-month growth of which appears to have fallen for a fifth successive month in April, based on preliminary calculations – second chart. (To recap, the global leading indicator is derived from the OECD’s country leading indicators and has led industrial output by four to five months on average historically.)
Business surveys, which provide little if any lead on industrial activity (though are more timely), are starting to cool on schedule. A global survey indicator combining responses on new orders or output expectations, mostly for the industrial sector, fell in April for the first time since August 2016, mainly reflecting a softer US ISM – third chart.
Major central banks are optimistic about economic prospects and concerned about inflationary risks from tight labour markets – the G7 unemployment rate is at its lowest level since 1980. They are likely, therefore, to be slow to respond to softer near-term data. Weaker economic / earnings news with an absence of offsetting policy support could challenge current equity market valuations. Yields on Treasuries and other government bonds, meanwhile, may be underpinned by QE wind-down, worries about US fiscal laxity and possible end-2017 economic reacceleration.
UK inflation: strong core pick-up, food next?
UK annual consumer price inflation rose from 2.3% in March to 2.7% in April and remains on course to move above 3% later in 2017, exceeding the MPC’s upwardly-revised central forecast (showing inflation peaking at 2.8% in the fourth quarter).
The 2.7% April reading was above a consensus forecast of 2.6% but in line with the Bank of England staff’s projection in last week’s Inflation Report.
March inflation had been suppressed by a year-on-year fall in air fares due to the later timing of the Easter holiday in 2017 compared with 2016. This effect reversed in April. Excluding air fares, CPI inflation was 2.4% in March and 2.5% in April (2.54% before rounding).
The April increase was driven by “core” inflation rather than energy / food prices. The preferred core measure here is the CPI excluding energy, food, alcohol, tobacco and education adjusted for the estimated impact of VAT changes. This rose to 2.3% in April, the highest since 2012 – see first chart.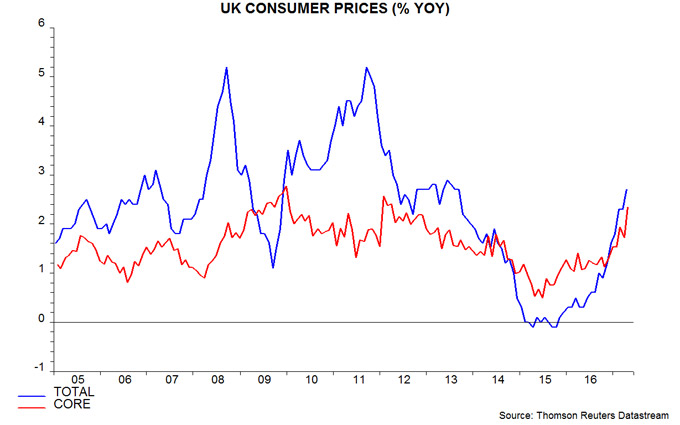
Core prices increased at a seasonally adjusted annualised rate of 2.9% in the three months to April from the previous three months – second chart. (Note that the seasonal adjustment programme used accounts for Easter timing effects.)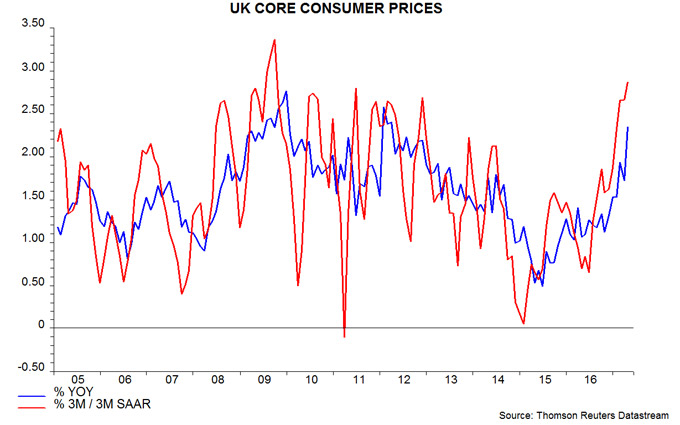
Annual core producer output price inflation – i.e. excluding food, beverages, tobacco and petroleum – also continued to pick up in April, reaching 2.8%, the highest since 2011. Core PPI inflation has often moved ahead of core CPI inflation historically, suggesting a further increase in the latter – third chart.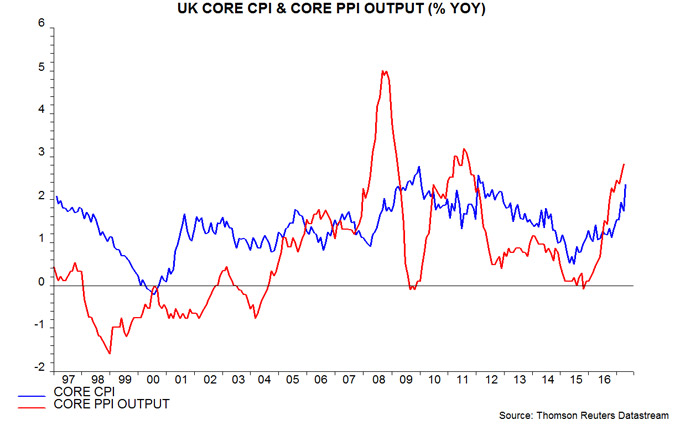 The long-standing forecast here that CPI inflation would move above 3% during 2017 was based on core inflation rising to about 2.5% and upward pressure on energy / food prices lifting the headline / core gap to more than 1 percentage point (pp). Core inflation is on track but the headline / core gap pulled back from 0.6 pp in March to 0.4 pp in April.
Stronger food price inflation should contribute significantly to a widening of the gap over coming months. Annual food inflation remained modest at 1.8% in April but large increases in home-produced and imported food material costs suggest a pick-up to perhaps 5-6% later in 2017 – fourth chart.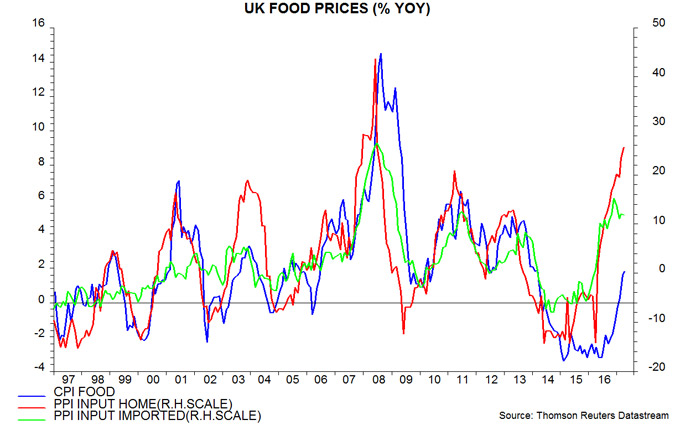
As previously argued, inflation is rising in lagged response to a significant increase in monetary expansion between 2011 and late 2016. The fall in the exchange rate has been part of the “transmission mechanism” from loose money to faster price rises, rather than being a primary driver. The historical evidence is that money growth peaks lead core inflation peaks by between two and three years. Assuming that annual broad money growth topped out last autumn*, the suggestion is that inflation will remain under upward pressure through late 2018, at least.
*Annual growth of non-financial M4 peaked at 6.8% in September 2016 and was 5.2% in March 2017.
