Entries from May 1, 2016 - May 31, 2016
Earnings revisions consistent with economic upturn
Global economic growth prospects are judged here to be the most positive since 2012, based on recent strong narrow money trends – see previous post. The favourable monetary signal has received tentative confirmation from an upturn in a non-monetary leading indicator derived from the OECD’s country leading indicator indices – see first chart below and this post.
Another development suggestive of an upturn in economic momentum is a recent rise in the net percentage of equity analysts who are upgrading their forecasts for the earnings of the companies they cover. Such revisions are usually driven by news in current earnings and forward guidance from companies, both of which are sensitive to changes in economic growth. The revisions ratio (i.e. upgrades minus downgrades divided by the total number of earnings estimates, seasonally adjusted) for constituents of the MSCI All-Country World index has recovered significantly since early 2016 – second chart. (Note that the “normal” level of the ratio is negative, reflecting a tendency for initial analyst estimates to be too high, except immediately after recessions.)
Most market economists base their short-term growth views on business surveys, although these are sometimes coincident rather than leading indicators. Globally, such surveys remain mixed. It is possible that companies’ responses to the surveys are being influenced by widespread gloom-mongering and US / UK political uncertainty. The media often fail to report more positive survey evidence, such as last week’s CBI industrial trends poll for May, showing an above-average net percentage of firms planning to increase output.
The upshot is that the consensus is ill-prepared for the positive economic growth surprise suggested by monetary trends. Such a surprise in 2012-13 gave a significant boost to equity markets while pushing up government bond yields.


Global money trends: positive signal affirmed
A post last week noted that global six-month real narrow money growth had risen to its highest level since 2009, suggesting economic strength in late 2016 / early 2017. A reader expressed scepticism about this forecast on the grounds that zero / negative interest rates are putting downward pressure on the velocity of circulation of narrow money – strong money growth, therefore, may reflect liquidity preference and have no implication for future activity.
It is true that the low level of interest rates has reduced the opportunity cost of holding narrow money, and the average level of real narrow money growth has been higher relative to industrial output expansion in recent years than during the post-WW2 period as a whole. The monetarist forecasting relationship, however, is directional – it relies on changes in real money growth leading changes in economic growth. This relationship remains strong.
The chart below shows global six-month industrial output growth and real narrow money expansion adjusted for 1) a long-run downward trend in the rate of change of velocity and 2) the average nine-month lag between turning points in real money growth and output expansion. This adjusted real money growth measure exhibits a significant contemporaneous correlation with output expansion*.
The economy was expected to lose momentum in early 2016, reflecting a slowdown in real narrow money expansion between February and August 2015. Recent economic weakness, therefore, does not constitute evidence that the predictive power of narrow money is waning. The adjusted real money growth measure suggests that the six-month change in industrial output will recover strongly between May 2016 and January 2017 (the last available month given the applied nine-month lead).
Zero / negative interest rates are helping to sustain a post-GFC rising trend in the ratio of narrow to broad money. Significant short-term changes in real narrow money growth, however, are still likely mainly to reflect changes in spending intentions, with implications for future economic activity. Economists and policy-makers historically have found various reasons to dismiss the significance of monetary trends; they have usually been wrong to do so.
*Correlation coefficient = 0.62 over 1965-2015 (51 years).

UK Treasury Brexit analysis: circularity and false precision
The Treasury today published its analysis of the short-term economic impact of a “Brexit” vote. The report states that the economy would fall into a recession immediately following such a vote on 23 June, with no recovery until the third quarter of 2017 at the earliest. After two years (i.e. by the second quarter of 2018), GDP would be between 3.6% and 6.0% lower than in the alternative scenario of a vote to remain.
The analysis assumes that a Brexit vote would have large negative effects on long-run income expectations, uncertainty and financial market conditions. It then attempts to quantify the impact of these assumptions on key macroeconomic variables.
The analysis is internally consistent but it is important to realise that the forecast of a significant recession flows directly from the Treasury’s assumptions.
A key role is played by a composite measure of uncertainty based on financial market prices and consumer / business surveys. The Treasury shows that this measure has been negatively related to household consumption, business investment and financial market conditions historically. It would be expected to rise following a Brexit vote, but by how much?
The Treasury assumes an increase equivalent to between 1.0 and 1.5 times the measure’s historical standard deviation. This implies a level of uncertainty reached previously only during recessions and the Eurozone crisis – see chart. The Treasury’s modelling work traces out the direct and indirect (via financial market conditions) implications for GDP and other macroeconomic variables. The conclusion of a recession, however, is circular – it depends on the assumption that uncertainty rises to a level rarely reached outside recessions.
The extent of a post-Brexit-vote rise in uncertainty is unknowable. The value of detailed forecasting exercises that assume away this lack of knowledge is questionable.

Chinese industrial output on recovery trend despite April setback
Chinese activity numbers for April fell short of consensus expectations but are judged here to be consistent with a firming growth trend.
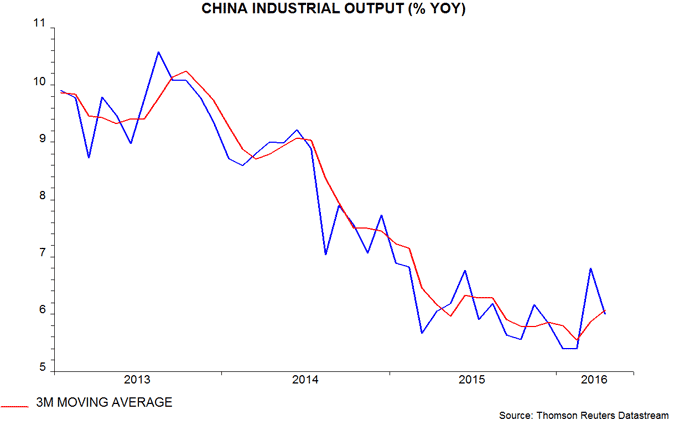
Annual industrial output growth fell back to 6.0% in April from 6.8% in March, a nine-month high. A previous post suggested that the late timing of the Chinese New Year in 2015 had depressed February 2016 growth relative to trend, with a corresponding overshoot in March. A normalisation was expected in April. A three-month average is a better guide to the trend and rose in April to its highest level since August – see first chart.
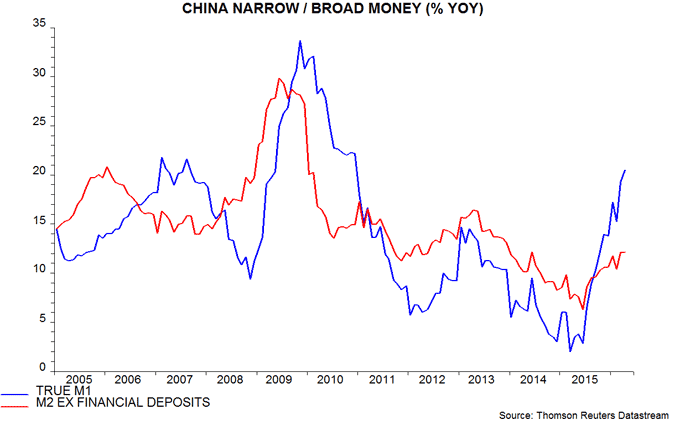
The PBoC this week released additional monetary data for April, allowing calculation of the “true M1” narrow money measure monitored here. Annual growth of this measure rose further to 20.5% last month, the fastest since 2010 – second chart.
The preferred broad money measure here is M2 minus financial sector deposits, which are less likely to be related to future spending on goods and services. Such deposits grew strongly in 2014-15 but have stabilised this year. Annual growth of M2 minus financial sector deposits has risen since mid-2015 and, at 12.1%, is in the middle of its range in recent years – second chart. Faster growth of narrow money reflects a switch from time deposits into demand / temporary accounts, consistent with rising spending intentions.

UK services turnover data suggesting economic resilience
UK services turnover strengthened in March, supporting the view here that economic growth remains solid, in contrast to downbeat consensus commentary.
The turnover survey is an important input to the services output index, which accounts for 79% of the output-based measure of GDP. Real turnover* fully reversed a fall in February to stand well above its fourth-quarter level – see first chart.
The estimate by the Office for National Statistics (ONS) that GDP rose by 0.4% in the first quarter assumed that services output grew by 0.2% between February and March. The turnover result suggests that this assumption will be met or exceeded. Revised GDP figures to be released on 26 May may confirm 0.4% growth for the economy as a whole last quarter but the increase in gross value added excluding oil and gas extraction could be revised up from 0.4% to 0.5%.
The consensus believes that the economy is slowing in the current quarter, with the Bank of England projecting a GDP rise of 0.3%. This belief, however, relies importantly on weaker business survey evidence that may have been “contaminated” by Breferendum uncertainty.
Any slowdown should prove short-lived assuming a Bremain vote, judging from upbeat money and credit trends – second chart.
Addendum: Revisions to GDP data up to 2014 released by the ONS today show stronger growth than previously reported in 2010, 2012 and 2014, offset by weaker outturns in 2011 and 2013. Annual growth in 2014 is now estimated at 3.1% versus 2.9% previously and a forecast here at the time of “about 3%”.
*Total ex. wholesale trade turnover, deflated by services producer prices, seasonally adjusted.


US Fed minutes hawkish but hike conditions not yet in place
The Federal Open Market Committee (FOMC) is unlikely to raise interest rates on 15 June even though minutes of its April meeting show that “most” participants (including non-voting members) were inclined towards such a move.
If the Committee had embraced a June increase as a central scenario, it is likely that the April policy statement would have referred to possible action “at the next meeting”, as did the October 2015 statement preceding the December rate hike.
The majority inclined towards a June move, moreover, required evidence of “economic growth picking up in the second quarter, labor market conditions continuing to strengthen, and inflation making progress toward the Committee's 2 percent objective”. Recent news is unlikely to have provided sufficient reassurance on these issues.
GDP growth should recover this quarter from just 0.5% annualised in the first quarter (below the Fed staff’s estimate) but may remain below par. The New York Fed’s “nowcasting” model is currently predicting growth of only 1.2%. The Atlanta Fed’s model is more optimistic, at 2.5%.
The April employment report released in early May, meanwhile, was slightly disappointing, with monthly payrolls growth slowing to 160,000 from a first-quarter average of 200,000, and the unemployment rate staying at 5.0%, up from 4.9% in January / February.
Annual consumer price inflation rose to 1.1% in April but the core rate excluding food and energy eased to 2.1% from 2.2% in March and 2.3% in February. The Fed prefers the personal consumption expenditures (PCE) price index as a gauge of inflation. Core PCE inflation was 1.6% in March; a June FOMC hike will be very unlikely if the April reading due on 31 May mirrors the decline in core CPI inflation – see chart.
The expectation here, based on the normal lag between narrow money and the economy, is that GDP growth will remain soft in the second quarter but rise significantly during the second half. Recent economic weakness may subdue labour market trends near term. Such a scenario could be consistent with a rate increase in September. There is a case for the FOMC to act preemptively but it is usually reactive (and too late).

