
Entries from May 1, 2014 - May 31, 2014
Eurozone narrow money losing momentum
 Simon Ward
 Post a Comment
Six-month growth of Eurozone real narrow money* fell in April but remains within its range over the past year and at a respectable level by historical standards – see first chart. This suggests that the economy will expand at a stable, moderate pace through late 2014.
The failure of narrow money trends to strengthen further is slightly disappointing, as is country-level evidence showing the periphery starting to lag again – second and third charts. Peripheral economic recoveries will be sustained but growth may be insufficient to make inroads into high unemployment.
The ECB is expected to cut its main refinancing and deposit rates next week while offering cheap longer-term funding for bank lending. This will have little direct impact on the money supply but the associated fall in market rates may stimulate spending intentions, causing narrow money to pick up again.
A parallel cut in the main refinancing and deposit rates will reduce banks’ net payments to the ECB, since their repo borrowing exceeds holdings of cash in current accounts and the deposit facility by €448 billion**. Peripheral institutions with high borrowing and no excess reserves will benefit at the expense of cash-rich core banks. The introduction of a negative deposit rate will require a change to current arrangements whereby banks can hold excess cash in current accounts earning no interest – such holdings may be limited to a given percentage of required reserves.
*Non-financial M1 deflated by consumer prices, seasonally adjusted. Non-financial M1 comprises notes and coin in circulation and overnight deposits of households and non-financial firms.
**As of 23 May.


Are global investors wrongly positioned?
Global fund managers have raised their cash weighting towards the top of its historical range, according to the May Merrill Lynch survey – see first chart. Defensive positioning would be warranted if monetary policies had tightened and the economic cycle was turning down. The indicators tracked here, however, suggest that monetary conditions have loosened since end-2013 while economic growth is about to pick up.
A turnaround in Chinese economic momentum is signalled by today’s May flash PMI survey conducted by Markit, showing a further rebound in new orders – second chart. This rise is consistent with recent stronger monetary trends – see previous post – and should be confirmed by the official survey released at the start of June. Japanese new orders also recovered this month but Eurozone orders softened*.
Stronger global growth over the remainder of 2014 could be associated with stable to easier monetary policies. The Fed and Bank of England have all but ruled out rate rises this year, while the ECB is certain to cut next month, and China may soon reduce reserve requirements. Firmer currencies should facilitate easing in other emerging economies – Turkey cut rates unexpectedly today. Longer-term bond yields have declined in most markets recently – third chart.
Stocks in cyclical industries should outperform non-cyclicals if global economic conditions strengthen. Cyclicals have lost ground during the growth slowdown between late 2013 and this spring but usually exhibit relative strength after the global longer leading indicator tracked here moves above average, as it has this month – fourth chart*. The Merrill Lynch survey suggests that fund managers are underweight cyclical exposure.
*Manufacturing surveys – the Eurozone services survey strengthened.
**The cyclicals grouping shown includes materials, capital goods, consumer durables and IT. Non-cyclicals include utilities, healthcare and consumer staples.
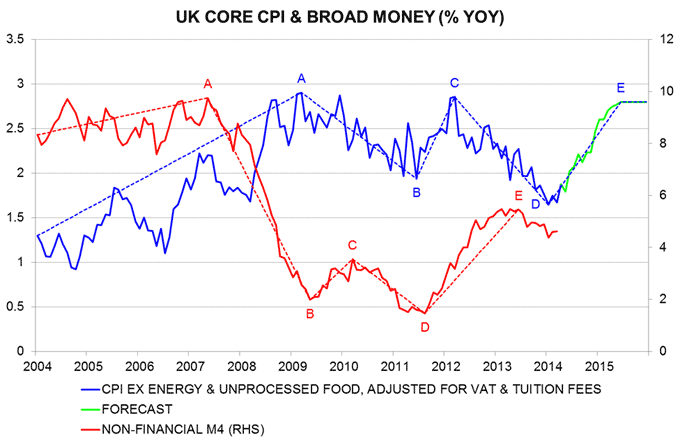
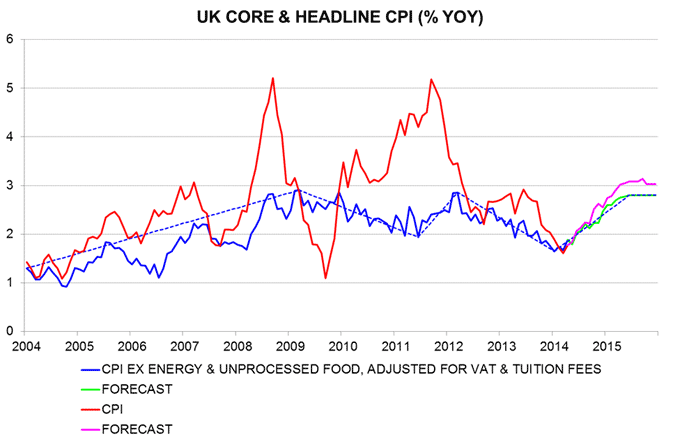
UK inflation bottoming on schedule
A small move higher in headline and core CPI inflation in April is consistent with the long-standing forecast here of a trend change from down to up in spring 2014 in lagged response to stronger monetary trends in 2012-13.
Posts in August and September last year argued that inflation would fall further in the short term, undershooting the Bank of England’s then forecasts significantly. The decline has been larger than expected, reflecting a stronger exchange rate and weaker global energy and food prices than had been assumed.
The first chart below is an update from the August post showing that major turning points in core inflation over the past decade have followed trend changes in broad money expansion roughly two years earlier, consistent with the Friedmanite rule. The core inflation measure tracked here* was expected to reach a low of 1.9% in late 2013 corresponding to a trough in money growth in late 2011. The decline extended slightly further and longer than expected, to 1.65% in January.
Core inflation, however, returned to 1.9% in April, a five-month high, and the monetarist rule suggests that it will now trend higher through mid-2015. With money growth rising by more in 2012-13 than in the prior 2009-10 upswing, it is reasonable to expect core inflation at least to regain its previous high of 2.8% next year, assuming that the drag from a strengthening exchange rate subsides.
Headline inflation fell for longer and by more than the core rate because of favourable energy and food price trends in late 2013 / early 2014. Global energy and other industrial commodity prices are expected to firm along with economic growth over coming months. Food commodity prices have already recovered significantly, suggesting that CPI food inflation is at or close to a low.
Unprocessed food and motor fuel inflation is assumed to recover to 4% by early 2015, with household energy bills rising at the same rate. Together with the projected strengthening of core trends, this implies that the headline rate will return to 3% next year – second chart.
*The annual rate of change of the CPI excluding energy and unprocessed food, adjusted for the estimated impact of VAT changes and the large rise in undergraduate tuition fees from 2012.
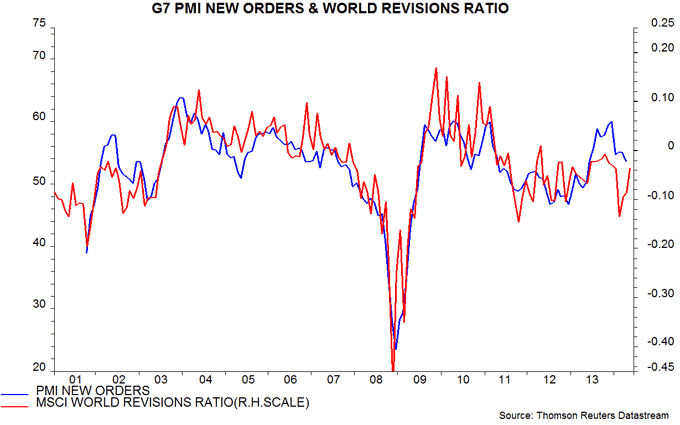
Earnings revisions consistent with economic cycle turn
The forecast that global industrial momentum is reaching a short-term low around now and will rise over the summer implies that PMI new orders indices – a coincident to slightly leading indicator of the cycle – will move higher by mid-year. May flash PMIs are released later this week. The G7 PMI new orders index correlates with the developed markets earnings revisions ratio*, although the latter is more volatile. The ratio rose again this month**, suggesting a coming PMI increase – first chart. This reflected both more earnings upgrades and fewer downgrades.
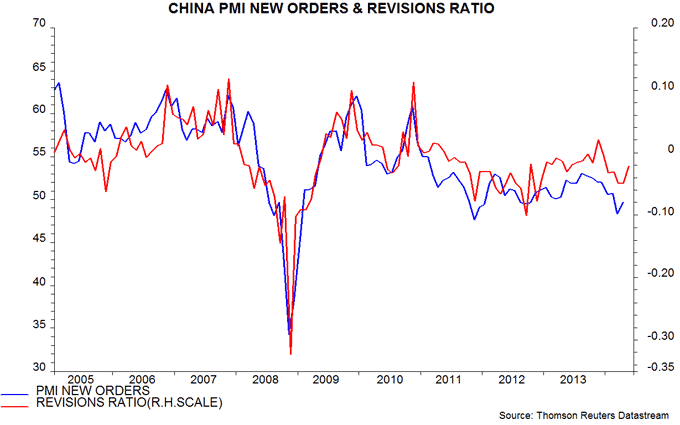
A PMI*** / revisions ratio correlation is also evident in Chinese data and is similarly hopeful, consistent with recent stronger monetary trends – second chart and previous post.
*The net percentage of equity anaylsts’ company earnings forecasts raised over the last month.
**The ratio is calculated on a mid-month to mid-month basis.
***Official PMI new orders, re-seasonally adjusted.
Global money trends still positive
Global economic weakness highlighted by below-expected output data this week was signalled by slower real narrow money expansion in late 2013. Money trends have since improved, with incoming April numbers mostly positive: investors should beware of economic pessimism.
US industrial output fell by 0.6% in April, Chinese production was flat, while Japanese manufacturing is expected to have contracted by 1.4%, according to a METI survey. Eurozone first-quarter GDP growth, meanwhile, was 0.2% versus a consensus 0.4% and the US number will probably be cut to negative later this month.
The available April information suggests that global six-month industrial output growth fell to about 1.5% last month, a 10-month low – see first chart. The forecast here has been for growth to reach a trough around May.
Global six-month real narrow money expansion rebounded from November 2013 and remained solid in April, based on available data. US growth was little changed while Brazil, China and India rose – second chart. Japanese April money numbers were disappointing – see Wednesday’s post – but the sharp fall in real growth mainly reflects a temporary inflation spike caused by the sales tax hike. This explains the currently-estimated small decline in the global measure last month – first chart.
Stronger global industrial expansion over the summer should be led by the US, which has driven the improvement in monetary trends. Consistent with this view, US retail sales have rebounded from winter weakness, suggesting that the ISM manufacturing new orders index, a good indicator of the industrial cycle, will recover by June – third chart.


Japanese experience cautionary for Eurozone QE enthusiasts
Japanese monetary trends continue to defy the predictions of QE supporters. The Bank of Japan (BoJ) bought ¥70 trillion of government securities in the year to April, equivalent to 15% of annual GDP and 6% of the M3 broad money supply. Yet annual M3 growth has hardly budged – 2.8% in April versus 2.6% a year earlier.
M3 expansion might have been weaker in the absence of QE but the policy has clearly failed to deliver the intended big liquidity injection to the wider economy. A key reason is that the BoJ’s bond-buying has been significantly offset by selling by banks, as had seemed likely at the outset. The BoJ and banks have, in effect, swapped securities and central bank reserves, with no impact on the money holdings of households and firms.
The first-round effect has been small but will there be a secondary boost, as banks deploy their increased reserves? US / UK experience is discouraging and money trends are currently losing, not gaining, momentum: six-month growth of the main aggregates has declined sharply since January – see chart.
QE supporters cite its role in pushing the yen lower and moving the economy out of deflation, at least temporarily. With nominal money and wage trends little changed, however, the inflation rise has squeezed real liquidity and incomes, cutting domestic demand. The yen slump, meanwhile, has failed to boost exports, partly because firms have widened margins: volumes in March were up only 1% on a year earlier.
Japan’s experience argues against Eurozone QE. Low Eurozone inflation is attributable to restrictive monetary conditions two years ago. Faster money growth in 2012-13 laid the foundations for the current economic recovery and should be reflected in a slow revival in inflation through 2015. The ECB is unlikely to launch full-scale QE but, if it did, the net impact on the economy would probably be small or even negative.
