Entries from March 1, 2017 - March 31, 2017
UK data wrap: positive current account surprise
 Simon Ward
 Post a Comment
UK monthly sectoral output numbers suggest that quarterly GDP growth will slow to 0.4-0.5% in the first quarter from 0.7% in the fourth quarter. GDP price data, meanwhile, confirm a pick-up in domestic inflationary pressures, with the annual rise in the GDP deflator unrevised at 2.8% in the fourth quarter. The current account deficit fell sharply last quarter, reflecting stronger trade performance in both goods and services and a further fall in net income paid abroad.
Highlights of today’s batch of data releases include:
-
GDP fell by 0.2% between December and January to stand 0.3% above the fourth-quarter level. The decline spanned sectors, with services, industrial and construction output down by 0.1%, 0.4% and 0.4% respectively. The soft start to the quarter suggests downside risk to the Bank of England staff “nowcast” of 0.6% growth in the first quarter at the time of the March MPC meeting.
-
Services output growth in the third and fourth quarters was revised down slightly, resulting in a reduction in third-quarter GDP expansion from 0.6% to 0.5% with fourth-quarter growth unchanged at 0.7% rather than revised up (as earlier data had suggested).
-
The 2.8% annual rise in the GDP deflator in the fourth quarter was the strongest since 2008. The gross value added deflator – which excludes indirect taxes and subsidies – was up by 2.6%. Measured from the income side, employee compensation per unit of output rose by 2.3%, while the unit contribution of profits, rents and other income was up 3.1%. These numbers confirm that the current inflation pick-up has a significant domestic element.
-
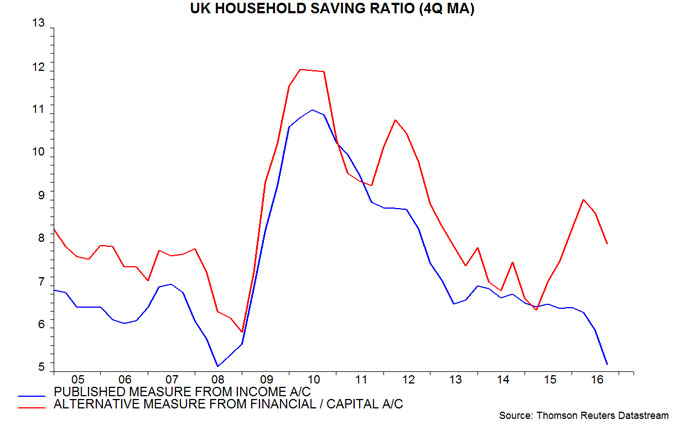
The official measure of the household saving ratio fell to 5.2% in 2016 and 3.3% in the fourth quarter, a record low in data extending back to 1963. An alternative measure of the saving ratio derived from the financial / capital accounts remains significantly higher than the official series, giving a more favourable impression of consumer finances, but also declined last year – see first chart below and previous post for more details.
-
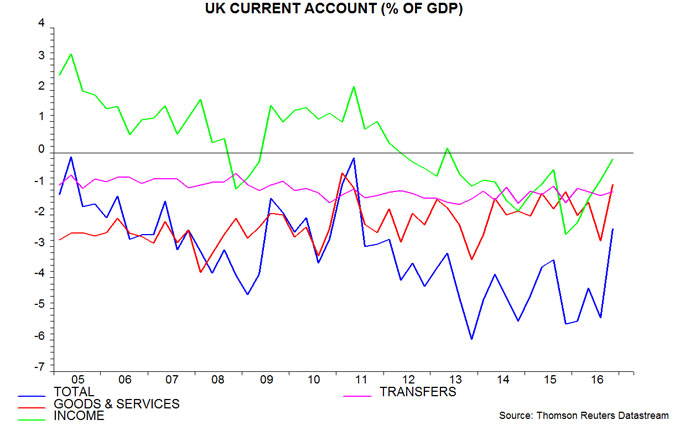
The current account deficit fell from 5.3% of GDP in the third quarter to 2.4% in the fourth, reflecting a smaller trade shortfall in goods and services and a further decline in the income deficit to the lowest since 2013 – second chart. The services trade surplus matched a previous record 5.4% of GDP last quarter as exports – particularly to non-EU countries – continued to grow robustly. The recent decline in the income deficit has been driven by a strong recovery in foreign direct investment earnings probably mainly due to the translation effect of sterling weakness and higher oil prices / profits – fourth-quarter earnings were up by 64% from a year earlier.
-
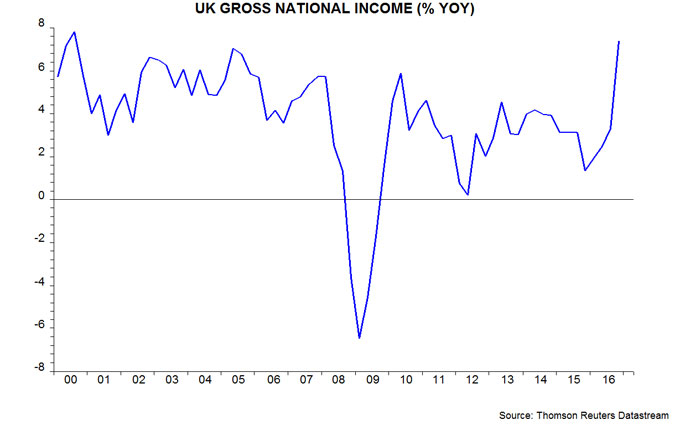
The combination of solid output expansion, accelerating domestic prices and a big decline in net income paid abroad resulted in gross national income surging by 7.4% in the year to the fourth quarter, the strongest annual increase since 2000 – third chart.
UK real money squeeze suggesting late 2017 weakness
UK narrow and broad money trends have weakened since the autumn, with rising inflation acting as a further drag on real-terms expansion. Allowing for the usual six to 12 month lag, this suggests that the economy will expand respectably through mid-2017 but slow sharply in the second half.
UK money trends are diverging negatively from those in the Eurozone. As noted in Monday’s post, annual growth of Eurozone narrow and broad money – as measured by non-financial* M1 and non-financial M3 – rose to 10.0% and 5.8% respectively in February, representing 16-month and eight-year highs. In the UK, by contrast, annual non-financial M1 growth peaked at 10.2% in September 2016 and fell to 8.6% in February, an 11-month low. Broad money growth – as measured by non-financial M4 – declined from 6.8% to 5.4% over the same period. The change of trend suggests that the recent pick-up in nominal GDP expansion will tail off and reverse later in 2017 – see first chart.
Shorter-term money trends signal a likely further decline in annual expansion. Non-financial M1 rose by 3.5%, or 7.2% at an annualised rate, in the six months to February, with non-financial M4 up by 2.0%, or 4.0% annualised. With consumer prices accelerating, six-month real growth of the two measures is the lowest since 2012 and 2011 respectively – second and third charts.

Why has money growth slowed? The demand to hold narrow money is influenced importantly by spending intentions, explaining why it leads the economy. Households and firms may be scaling back spending plans in response to Brexit uncertainty and rising prices / costs, with these negatives outweighing favourable global economic conditions. Real M1 holdings of households and private non-financial corporations (PNFCs) have slowed similarly, suggesting weaker prospects for both consumer spending and business investment – fourth chart.
Broad money fluctuations are viewed here as being driven by supply-side influences such as credit trends and balance of payments flows in the short run, with demand adjusting to supply further out. The recent slowdown appears to reflect a moderation of lending growth – second chart – and a rise in banks’ non-deposit funding. To the extent that the September-February QE programme had any positive impact, it was more than offset by other factors.
The MPC is now in a stagflationary bind of its own making. The failure to act to check rising money growth in 2015-16 suggests upward pressure on inflation through late 2018, at least – see previous post. Belated policy action, however, will be presentationally and politically difficult against the backdrop of a second-half economic slowdown suggested by real money trends. A possible scenario is that the MPC will make a token reversal of its ill-advised August rate cut later in 2017 while relying on the Brexit excuse to deflect blame for poor inflation / growth outcomes and avoid a more significant policy adjustment.
*Non-financial = held by households and non-financial corporations (i.e. excludes financial sector money).
Eurozone money trends arguing for earlier ECB exit
Eurozone narrow and broad money growth remains strong, suggesting a stable, solid economic outlook and rising pressure on the ECB to accelerate its “exit strategy”.
The narrow aggregate non-financial M1 – comprising currency in circulation and overnight deposits of households and non-financial corporations (NFCs) – has the strongest correlation with future GDP growth, according to ECB research. Annual growth of this measure was 10.0% in February, the fastest since 2015. The recent pick-up suggests that nominal GDP expansion will rise through 2017 – see first chart.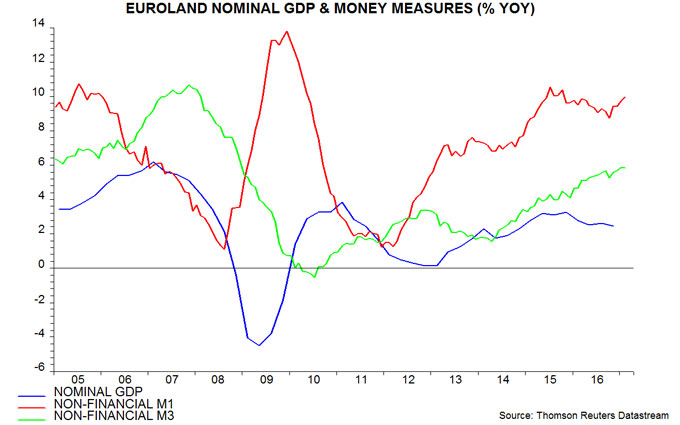
The broader non-financial M3 aggregate has also accelerated, with annual growth of 5.8% in January / February the fastest since 2009 – first chart.
The headline M1 and M3 measures include money holdings of financial corporations but these are volatile and contain little information about near-term spending prospects. Analysts focusing on the headline measures are at risk of underestimating future economic growth, as financial sector money has been falling – M1 grew by an annual 8.4% in February (versus 10.0% for non-financial M1) and M3 by 4.7% (versus 5.8% for non-financial M3) – second chart.
The third chart shows the two-quarter change in GDP and six-month changes in real (i.e. consumer price-deflated) non-financial M1 and its household / NFC deposit components. Real non-financial M1 growth has moderated since mid-2016 but remains solid by historical standards. The recent slowdown has been entirely due to a pick-up in consumer price inflation – nominal money growth has remained buoyant. Both household and NFC real deposits are rising strongly, suggesting solid prospects for consumer spending and business investment.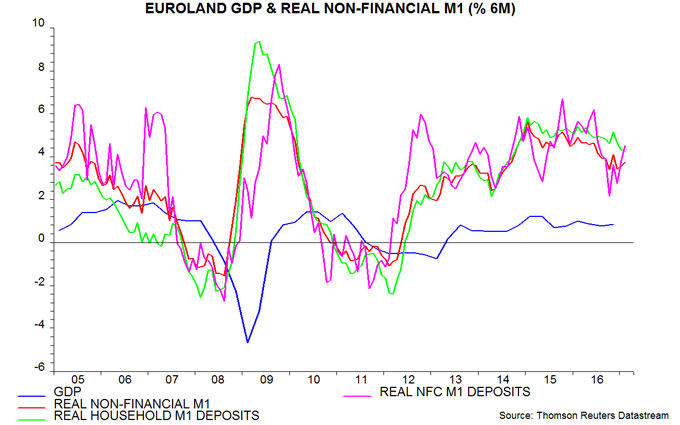
Some monetary economists attribute favourable monetary and economic trends to the ECB’s QE programme. The bulk of the rise in non-financial M1 growth, however, occurred over 2012-14 before QE started in March 2015. GDP expansion had also strengthened significantly before the QE launch – two-quarter GDP growth, indeed, peaked at 1.25% (2.5% annualised) in the first quarter of 2015. ECB interest rate cuts and lending to the banking system, and the slow repair of bank balance sheets, have probably been the key drivers of strengthening money trends.
Six-month real non-financial M1 growth is close to its average since 2013, a period during which GDP expanded by 1.7% per annum (i.e. between the fourth quarters of 2013 and 2016). The Eurozone unemployment rate fell by 0.8 percentage points per annum between end-2013 and end-2016. Current monetary trends, therefore, suggest GDP growth of about 1.75% during 2017 and a fall in the jobless rate from 9.6% at end-2016 to below 9% at end-2017. This would be close to the OECD’s estimate of the “NAIRU” (non-accelerating-inflation rate of unemployment) – fourth chart.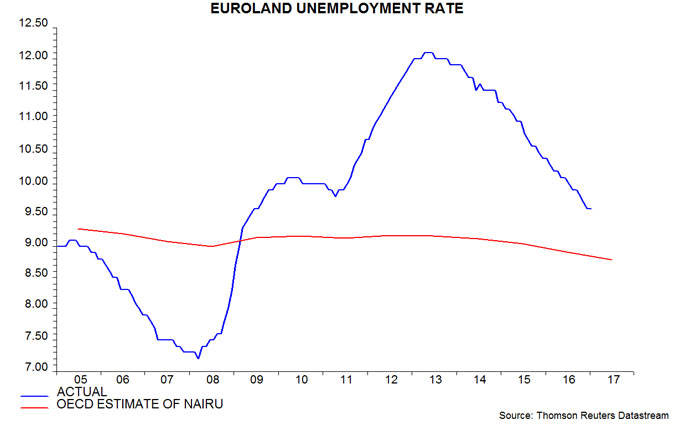
Such a scenario suggests rising pressure on the ECB to accelerate its “exit strategy”. In the US, the FOMC halted QE in October 2014 when the unemployment rate was 0.5 percentage points above the mid-point of the Committee’s "central tendency" range for the long-run equilibrium rate (i.e. 5.9% versus 5.35%). It began hiking rates in December 2015 as the jobless rate converged with this mid-point (by then reduced to 4.9%). If the ECB were to behave similarly, it might end QE in summer 2017 and raise rates at the start of 2018. It might, however, choose to reverse the order and lift rates first, on the view that an abrupt end to QE would risk undermining peripheral bond markets.
US earnings revisions suggesting ISM peak
US narrow money trends may be starting to recover but earlier weakness suggests slower economic growth through late 2017. The latest US earnings revisions data are consistent with an imminent peak in the widely-watched ISM manufacturing new orders index. Chinese earnings revisions, by contrast, have strengthened.
The six-month rate of change of US real (i.e. consumer price-adjusted) narrow money peaked in April 2016 and fell sharply from August, turning slightly negative in February. As previously discussed, momentum changes in real narrow money have consistently led those in GDP in recent years, with the relationship suggesting that two-quarter GDP growth peaked in the fourth quarter of 2016 and will fall through the third quarter of 2017 – first chart.
Real narrow money growth, however, may be recovering in March – the last data point in the first chart is a March estimate based on the latest weekly nominal number (for the week to 13 March) and an assumed 0.2% monthly increase in the CPI. The recovery probably partly reflects income tax refunds catching up with the normal schedule after a delay due to legal changes: refunds fell by $25 billion year-on-year in February but the daily average so far in March (i.e. to 22 March) is up by 25% from March 2016, suggesting a full-month gain of $21 billion.
In addition, the Treasury has run down its cash balance to maximise its borrowing headroom ahead of difficult negotiations with Congress over raising the federal debt ceiling. The Treasury’s general account balance at the Fed has fallen from $391 billion in late January to $71 billion in the latest week. Funding the deficit by running down cash boosts bank reserves and money measures, ceteris paribus.
The forecast of softer economic momentum through the third quarter implies that short-term leading indicators such as the ISM manufacturing new orders index should be at or near a peak. Regional Fed manufacturing surveys released so far in March have been super-strong, generating expectations that the next ISM reading will remain buoyant. However, the US earnings revisions ratio (i.e. analyst upgrades minus downgrades as a proportion of the total number of earnings estimates, seasonally adjusted) correlates reasonably well with the ISM (correlation coefficient = 0.72 since 2005) and fell in March – second chart.
The Chinese revisions ratio, by contrast, reached its highest level since 2013, suggesting a strong National Bureau of Statistics (NBS) March manufacturing purchasing managers’ survey – third chart.
UK inflation rise due to loose money not Brexit
A post in October 2016 forecast that UK CPI inflation would rise above 3% in 2017, exceeding Monetary Policy Committee (MPC) and consensus projections. This was based on “core” inflation moving up to about 2.5% by late 2017 and higher sterling commodity prices lifting the headline / core gap to over 1 percentage point*. February numbers released yesterday are consistent with this forecast: core inflation rose to 1.9%, the highest since 2012, and the headline / core gap to 0.4 – see first chart.
The MPC argues that the inflation rise is a temporary consequence of sterling weakness caused by the Brexit vote. A “monetarist” view, by contrast, is that inflation is climbing in lagged response to a significant pick-up in monetary growth between 2011 and 2016. Annual broad money expansion, as measured by non-financial M4, rose from below 2% in 2011 to nearly 7% late last year – second chart. A post in May 2016 showed that similar upswings in monetary growth historically were followed by a sustained rise in core inflation. The post suggested that core inflation would be on an upward trend from late 2016.
The weaker exchange rate, on this view, is part of the “transmission mechanism” from faster money growth to higher inflation, rather than being a primary driver. It is plausible that sterling would be significantly higher if the Brexit referendum had resulted in a “remain” vote. In that case, however, the economy would probably be much stronger – a post in December 2016 suggested that GDP would have grown at an annualised rate of about 3.5% during the second half of 2016 rather than the currently-estimated 2.6%. Greater upward pressure on domestic costs and margins, therefore, would have counterbalanced a smaller import price boost. (The annual rate of change of the GDP deflator, a measure of domestically-generated inflation, rose to 2.8% in the fourth quarter of 2016, an eight-year high.)
The monetarist view implies that the inflation rise will be a level shift rather than a temporary “blip”. Annual non-financial M4 growth has retreated from a peak of 6.8% in September 2016 to 5.5% in January but remains elevated by the standards of recent years. The analysis in the May 2016 post found a two- to three-year average lead from money growth to core inflation, suggesting that upward pressure on the latter will persist through late 2018, at least.
Current broad money growth, admittedly, remains modest relative to the 1980s, 1990s and 2000s – non-financial M4 rose by 9.0% per annum (pa) on average over the 30 years to end-2009. The velocity of circulation of non-financial M4, however, fell by an average of 2.9% pa over this period**. Negative real deposit interest rates have reduced the demand for broad money, resulting in velocity stabilising since 2009. Sustained money growth at its current 5.5% pace, therefore, would suggest a similar rate of expansion of nominal GDP. With potential economic growth generally estimated to be 1.5-2.0% pa currently, such a rate of increase would be incompatible with the 2% inflation target***.
The monetarist view implies that the MPC should have raised interest rates last year as money growth was rising strongly, rather than easing policy in a panic reaction to the Brexit vote. The Committee may choose to reverse the August cut over coming months as inflation exceeds its forecast but is likely to continue to claim falsely that the pick-up is a temporary and unavoidable consequence of Brexit and does not require a fundamental policy rethink. A reasonable assessment is that the MPC has, in effect, shifted from inflation- to unemployment-targeting: the latest Inflation Report, after all, projects that the jobless rate will remain stable at close to its current level through 2020 even as inflation heads for a sustained overshoot.
*”Core” = CPI excluding energy, food, alcohol, tobacco and education adjusted for VAT changes.
**Velocity definition incorporates six-quarter lag on money stock.
***2017 potential growth estimates: OBR 1.9%, IMF 1.8%, EU Commission 1.6%, OECD 1.5%.
US corporate finances unpromising for business spending
US corporate profits weakened in the fourth quarter of 2016, casting doubt on expectations that business spending will drive a pick-up in economic growth.
Fourth-quarter financial accounts released by the Federal Reserve on 9 March contain the first official estimate of corporate profits calculated on a national accounts basis. Both headline profits and an “economic” measure that adjusts for stock appreciation and over- / under-depreciation fell between the third and fourth quarters. Economic profits were 11% below a peak reached in the fourth quarter of 2014 – see first chart.
These numbers may be revised in the “final” GDP report for the fourth quarter to be released on 30 March. As the chart shows, however, the quarterly decline in the national accounts profits measures tallies with S&P data on the aggregate reported and operating earnings of S&P 500 companies.
Bullish commentary may have been influenced by a sharp rise in year-on-year S&P 500 reported earnings per share (EPS) growth – from 9% in the third quarter to 29% in the fourth, according to S&P – but this is entirely explained by a favourable base effect due to EPS falling by 19% between the third and fourth quarters of 2015.
The profits measures in the first chart tend to lead the consensus 12-month forward S&P 500 EPS estimate. The fourth-quarter profits fall suggests downside risk to the current consensus estimate – second chart.
The Fed’s financial accounts show that the “financing gap” of non-financial corporations – the difference between their capital spending and retained earnings – rose to 0.4% of GDP in the fourth quarter, close to its long-term average (i.e. over 1985-2015) of 0.6%. This measure, however, understates the growth of leverage in recent years because it excludes borrowing to finance share buy-backs and cash takeovers. A broader corporate deficit measure adding in net equity purchases reached 3.8% of GDP in the second quarter of 2016 – significantly above a long-term average of 2.1%. It fell back, however, in the fourth quarter as net equity buying slowed sharply – third chart.
The financing gap measures have been inversely correlated with the future rate of change of business investment historically. The recent elevated level of the broader measure suggests that investment will grow moderately at best over coming quarters – fourth chart
The broader measure also correlates, with a typical lag of six quarters, with the yield spread between low-rated corporate bonds and Treasuries. This relationship suggests that the current spread is significantly below “fair value” – fifth chart.
One favourable balance sheet development recently has been solid growth of broad money holdings – non-financial corporate M3 rose by 6.6% in the year to end-2016. Liquid assets, nevertheless, have fallen since 2009-10 relative to credit market debt and the overall balance sheet – sixth chart.