Entries from March 1, 2014 - March 31, 2014
UK real wage pick-up undermines "fragile economy" claims
A measure of private sector pay incorporating a 12-month smoothing of bonuses rose by 0.9% more than consumer prices in the year to January, confirming that real wages are picking up more strongly than the Bank of England and consensus expected.
Private sector regular weekly earnings rose by 2.2% in the year to January versus CPI inflation of 1.9% in that month. Bonuses, meanwhile, increased by 8.7% in the 12 months to January from a year before. A measure of total pay calculated by adding regular earnings and a 12-month moving average of bonuses, therefore, rose by an annual 2.8% in January. This pay growth measure was below CPI inflation between July 2008 and November 2013 – see first chart.
Whole-economy growth, i.e. incorporating public sector workers, is lagging the private sector but was also above inflation in January, at 2.2%.
The earlier-than-expected resumption of real wage growth further undermines the Bank’s claims of economic fragility and may have a significant political impact – statistical analysis confirms that real wage trends influence the poll gap between the main governing and opposition parties.
A key issue is whether the real wage pick-up reflects a recovery in productivity growth or a shift in the balance of power in favour of workers, due to a tight labour market. Productivity optimists will cite an increase in aggregate hours worked of only 0.1% in the three months to January from the prior three months – well below quarterly GDP growth currently estimated at 0.7% in the fourth quarter. Some productivity catch-up, however, had been expected following dismal performance in the year to the third quarter, when whole-economy output per hour rose by only 0.1%.
The vacancy rate – the stock of unfilled positions expressed as a percentage of employee jobs – continues to suggest that labour market slack has been eliminated, rising further to 2.1% in the three months to January versus a post-1995 average of 2.0%. The divergence between the vacancy and unemployment rates casts strong doubt on the Bank’s view that the latter can fall to 6-6.5% without generating inflationary pay pressures – second chart.


US economic news consistent with further "taper"
The Federal Reserve is likely to taper bond purchases by a further $10 billion to $55 billion a month at its policy meeting this week and may stop buying by the end of the third quarter as the economy reaccelerates.
The chart shows a long history of the “headline” policy rate* together with an indicator** designed to summarize data influences on the Fed’s thinking. The indicator gave advance warning of changes in interest rate direction up to and including the 2008-09 crisis, and has been informative about QE policy more recently.
The indicator was below zero, suggesting policy easing, when the Fed launched QE1 and QE2 in December 2009 and November 2010 respectively. It turned significantly positive in early 2011, however, signalling that QE2 would not be extended beyond its scheduled end in June. A renewed slide towards zero during 2012 preceded the launch of QE3 in September of that year and its expansion in December.
The indicator had been recovering for several months when the Fed announced tapering in December 2013. It has risen further in early 2014 and is just below its level ahead of the suspension of QE2 in June 2011.
Monetary trends signalled that economic growth would moderate in early 2014 but are now suggesting another pick-up from mid-year – see previous post. If correct, the policy indicator may stabilise near term before pushing higher again in the summer. Economic reacceleration may cause the Fed to end QE3 in July or September rather than in the fourth quarter, as implied by tapering of $10 billion per meeting.
*The Fed has announced publicly its target for the Fed funds rate since February 1994; the discount rate was the immediately visible policy rate before that date.
**The indicator is based on changes in core CPI inflation and unemployment and the ISM manufacturing vendor deliveries index, which measures supply chain delays. The latter two components are responsible for the current positive reading.
Japan's QE blitz yields disappointing results
QE enthusiasts expected the bond-buying blitz launched by incoming Bank of Japan Governor Kuroda in April 2013 to boost the broad money supply substantially – one commentator suggested a 10% increase over a year. The view here was sceptical, on the grounds that higher BoJ purchases would be largely offset by stepped-up selling by banks, whose demand for liquid securities would fall as QE expanded their reserves – see previous post.
This view, so far at least, has proved correct. Banks reduced their investment account holdings of Japanese government bonds by a further ¥5.8 trillion in January (the latest available month), neutralising two-thirds of the impact of BoJ buying of ¥8.4 trillion. Annual growth of the broad M3 money supply measure slipped back to 3.2% in February – little changed from 2.5% in March 2013.
The QE lift to nominal money supply growth has been more than offset by higher inflation due mainly to the weaker yen. Real money expansion is lower now than in early 2013, helping to explain recent disappointing economic performance – see chart.
What happens next? Inflation will be boosted mechanically by next month’s sales tax hike but the yen effect is now fading and wage rises remain muted. If nominal money growth is stable, real trends may improve later in 2014 as price rises moderate, promising better economic conditions in 2015.
The risk is that the BoJ will raise the QE stakes, leading to further yen weakness that keeps inflation elevated and real money growth depressed – assuming, reasonably, that QE pass-through to nominal money trends remains minimal.
The BoJ, in other words, may sacrifice economic growth on the altar of its obsession to achieve 2% inflation.
Global leading indicators softening but monetary trends reassuring
Global short and longer-term leading indicators followed here suggest that recent slower economic growth will persist through late spring. As expected, the short indicator (average 2-3 month lead at turning points) fell further in January, while the longer measure (4-5 months) stabilised – see first chart. Six-month global industrial output growth appears to have peaked at end-2013 and, based on these readings, may decline into April / May.
The stabilisation in the longer-term leading indicator is tentative, subject to revision and should not be overemphasised. It is, however, consistent with a revival in global real narrow money expansion that started in December and continued in February, judging from early data – second chart*. Allowing for an average 6-7 month lead, this suggests a recovery in global economic momentum in mid-2014. The further rise in real money growth in February was driven by US strength and a reversal of weakness in China – see Monday’s post.
The investment implications of these divergent trends are open to debate. A possible scenario is that elevated equity markets will correct as near-term economic data softens before rebounding in anticipation of the stronger second half implied by monetary trends – assuming that the money growth pick-up is sustained. Bulls, of course, will argue that markets will look through a temporary soft patch, especially with data distorted by weather effects and a forward shift of Japanese demand / output ahead of April’s sales tax rise.
The uncertainty is mirrored by the two equities versus cash investment rules followed here – see previous post for more details. The first rule prefers equities if G7 real narrow money is growing faster than output; it remains invested currently. The second rule requires the G7 longer leading indicator to be above its historical average in order to hold stocks; it has recently shifted to cash. The last buy signals of the two rules were in September 2011 and August 2012 respectively.
*February monetary data are available for the US, China, Japan, India and Brazil, together accounting for about 60% of the global aggregate. Growth in other countries is assumed to be unchanged from January.


Chinese economy sluggish but hard landing risk contained
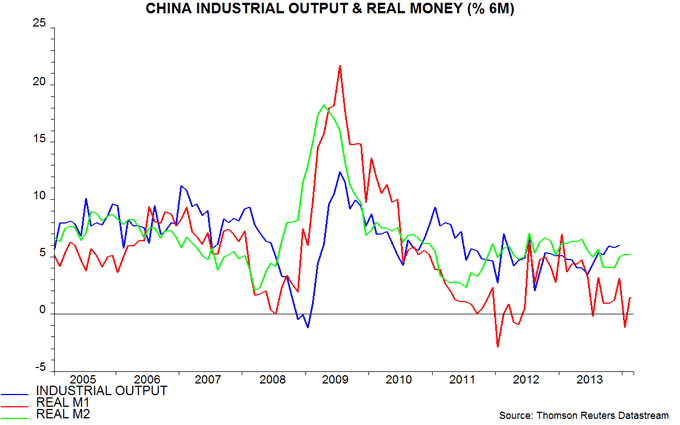
Chinese monetary trends are stable and consistent with continued subdued economic expansion.
Real narrow money works best as a leading indicator for most economies followed here but in China’s case the broader M2 measure has performed equally well in recent years. Six-month real M2 expansion was stable in February and close to its average over the last two years – see first chart.
The six-month change in real narrow money M1 had turned negative in January but this was attributed here to Chinese New Year’s Day coinciding with the end-month reporting date. A rebound duly occurred in February, although real M1 expansion remains weak by historical standards.
Monetary trends, therefore, suggest continued sub-par growth but no increase recently in the risk of a “hard landing”.
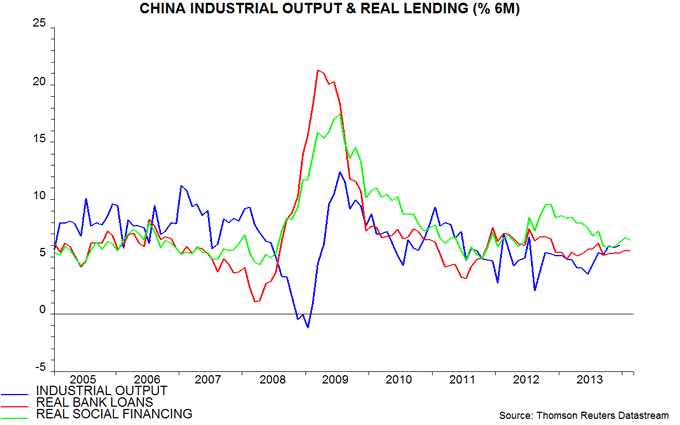
On the credit side, six-month expansion of real bank loans has been stable over the past year but the broader “total social financing” measure has slowed as the authorities have clamped down on off-balance-sheet lending – second chart. The broader measure is still growing faster than bank loans, suggesting no early relaxation of credit restrictions despite low inflation.
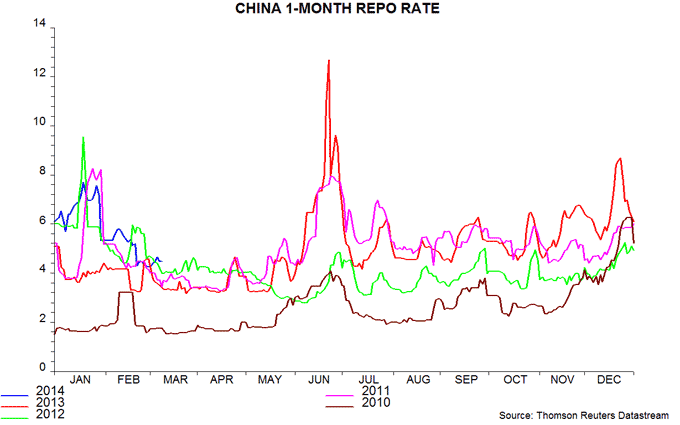
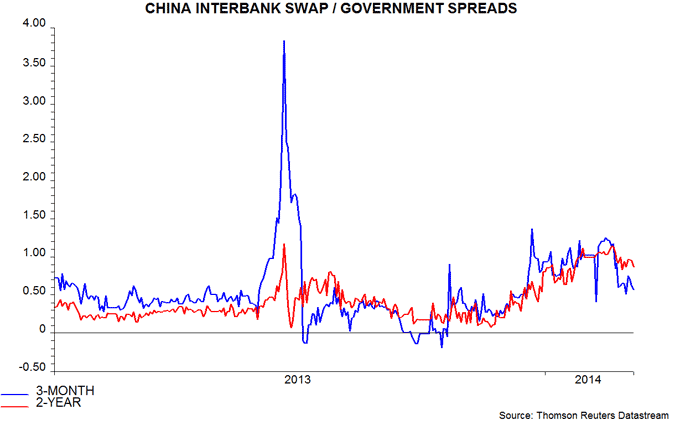
Money market conditions, however, have eased since the New Year, with the one-month repo rate now close to its level at the same stage of the last three years* – third chart. This easing has been accompanied by some narrowing of spreads between interbank swap rates and government yields, although these remain elevated – fourth chart.
In other Chinese news, exports slumped in February but much of the weakness was probably due to New Year timing effects and a reduction in disguised capital inflows, the latter reflecting both an official crackdown on fake invoicing and (correct) expectations of a weaker exchange rate.
*Money market rates exhibit a strong seasonal pattern, increasing the value of year-over-year comparisons.


Global economy slowing on schedule but H2 prospects brightening
OECD leading indicators released next week should confirm that global economic growth is moderating, in line with the forecast here. Monetary trends, however, suggest that the slowdown will be modest and temporary, with growth lifting again from the summer.
The first chart shows the OECD’s “normalised” G7 leading indicator, constructed so that a stable value implies economic expansion at trend. A peak in the indicator, in other words, signals that growth is about to shift from above to below trend. The chart shows actual data up to December 2013 together with a series estimated here by attempting to replicate the OECD’s calculations using the latest component information. The estimation suggests that values for November and December will be revised lower, while the indicator will fall marginally in January. The new OECD data, in other words, may strengthen market perceptions of a slowdown in growth in early 2014.
The second chart shows global (i.e. G7 plus emerging E7) industrial output growth together with short and longer-term leading indicators constructed here by combining and transforming the OECD’s normalised indicators for the G7 and individual emerging economies. These short and longer-term measures have led growth turning points by averages of 2-3 months and 4-5 months respectively in recent years. The latest values are again estimated; the short leading indicator is likely to fall further in January while the longer measure may stabilise at a weak level. 
The bias here, however, is to downplay the cautionary message from the leading indicators, for two reasons. First, recent weakness may have been exaggerated by the impact of bad weather on several of the components (e.g. US housing starts). As this effect unwinds, the trend estimates of the components incorporated in the indicators should be revised higher. The recent declines, in other words, may look smaller in three months’ time.
Secondly, the leading indicators are used here to confirm signals from global real narrow money expansion, which has led output growth turning points by an average 6-7 months in recent years. Real money expansion declined between May and September 2013, anticipating current economic softening – third chart. It bottomed at a respectable level, however, and has picked up in December / January, with US strength likely to result in a further rise in February – see previous post. Monetary trends, in other words, suggest that the slowdown will be modest and growth will regain momentum, led by the US, from mid-2014. Such a scenario, in turn, implies that the longer leading indicator should be at or close to a bottom.

