Entries from March 1, 2014 - March 31, 2014
UK monetary trends solid / stable; credit still weak
UK monetary trends remain upbeat, with rising corporate liquidity supporting hopes of strong business investment.
The forecasting approach here emphasises real narrow money, as measured by non-financial M1* deflated by consumer prices. This rose by 4.3%, or 8.7% annualised, in the six months to February. Growth has been stable since spring 2013 and is well above the long-run average – see chart.
Real non-financial M4, a broader measure, rose by a smaller 1.8%, or 3.5% annualised, although this represented the strongest growth since April 2009. As previously discussed, a given rate of increase of broad money supports faster nominal GDP expansion than in the past because the velocity of circulation is now on a rising trend. This partly reflects households shifting savings into non-monetary form in response to negative real deposit interest rates.
Modest overall M4 growth, in other words, has not prevented a strong rise in corporate liquidity: real M4 holdings of private non-financial corporations rose by 4.4%, or 8.9% annualised, in the latest six months.
The six-month rates of change of real non-financial M1 and M4 bottomed in April 2011, rising over the subsequent two years to peak in April 2013. Underlying two-quarter GDP expansion (i.e. excluding North Sea production and adjusting for special bank holidays and the Olympics) bottomed in the first quarter of 2012 and rose through the third quarter of 2013, stabilising in the fourth quarter. This is consistent with the monetarist rule that (real) money supply changes lead demand and output by about six months.
Stable real money trends since last spring are the basis of the forecast here that GDP will continue to rise by 0.75% per quarter through 2014**, generating full-year growth of about 3%. The first quarter, however, is likely to overshoot this projection, based on available evidence – see Friday’s post.
Real non-financial M4 lending contracted slightly in the six months to February – the claim that current economic strength is being driven by credit-fuelled excess continues to have no basis in fact.
*Currency and sterling sight deposits held by households and private non-financial firms.
**Growth averaged 0.75% in the final three quarters of 2013.

UK onshore GDP exceeds prior peak in January
First-quarter GDP growth is on course to match or beat the Bank of England’s 0.9% expectation, judging from January output figures for services, industry and construction, together accounting for 99% of the economy.
Output levels in January were above fourth-quarter averages in all three sectors – by 0.7% in services, 0.4% in industry and 1.8% in construction. Based on shares in the economy of 78%, 15% and 6% respectively, these gains imply a 0.75% rise in GDP between the fourth quarter and January.
Assume, reasonably, that GDP rises by a further 0.25% per month in February and March, equivalent to a 3% annualised growth rate. First-quarter expansion would then be 1.0%.
According to the February Inflation Report, the Bank expects first-quarter GDP growth to be estimated initially at 0.8%, with a subsequent revision to 0.9%. A 1.0% initial print*, therefore, would be another upside surprise for policy-makers.
GDP in the fourth quarter of 2013 was still 1.4% below its peak reached in the first quarter of 2008 but the shortfall in onshore output – i.e. excluding North Sea oil and gas extraction – was only 0.5%. Onshore GDP, therefore, is already at a new high, based on the January output data – see chart.
*The preliminary estimate is scheduled for release on 29 April.
Eurozone monetary trends signalling stable economic expansion
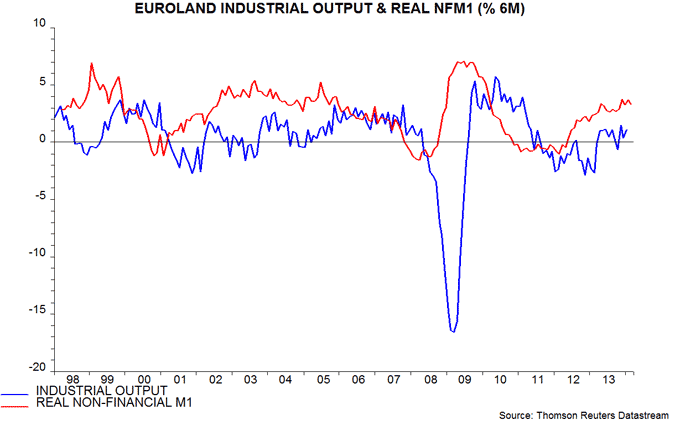
Eurozone real non-financial M1* – the best monetary leading indicator of the economy, with a flawless track record in recent years – continues to signal moderately positive growth prospects. Country trends suggest similar economic performance in the core and periphery.
Real non-financial M1 rose by 3.3% in the six months to February, or 6.7% annualised. Growth has been broadly stable in recent months and is above the long-run average. The six-month change turned negative before the 2008 and 2011 recessions and positive before the 2009 and 2013 recoveries – see first chart. Current trends are consistent with GDP expansion of about 2% annualised through late 2014.
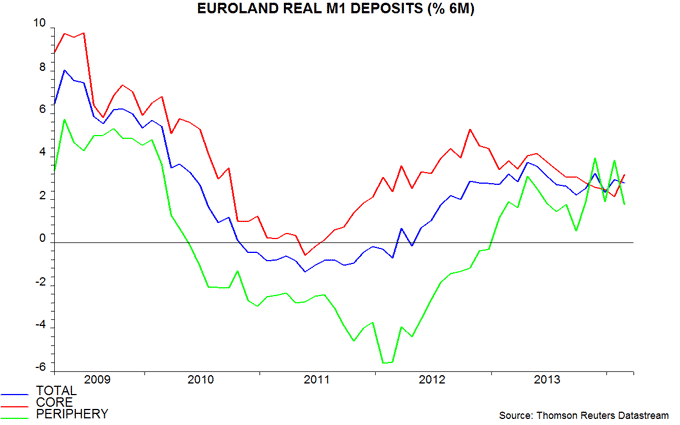
The ECB publishes country data on overnight deposits**, which dominate swings in M1. Six-month growth of real deposits in the core and peripheral groupings has been similar recently, suggesting economic convergence – second chart. Peripheral expansion was lower than in the core in every month between September 2008 and October 2013.
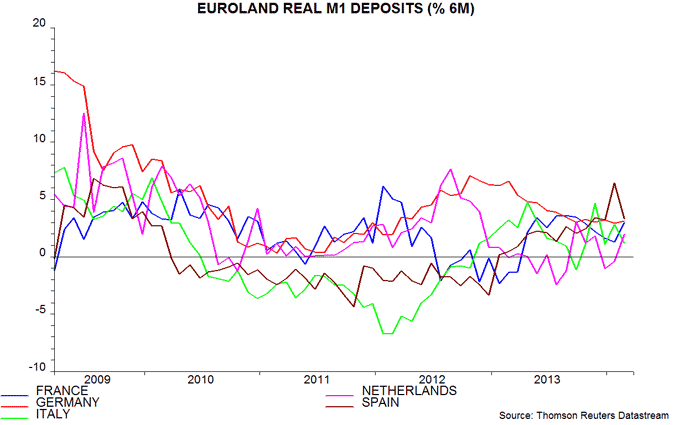
Country-level divergences have also narrowed, with real deposit growth now almost equal in Spain, Germany and France and only slightly lower in the Netherlands and Italy – third chart.
The economic recovery has defied the predictions of followers of broad money and credit. Six-month growth of Eurozone real M3 edged up in February but was still only 0.5% (1.0% annualised), while bank credit continues to contract, albeit at a slowing pace.
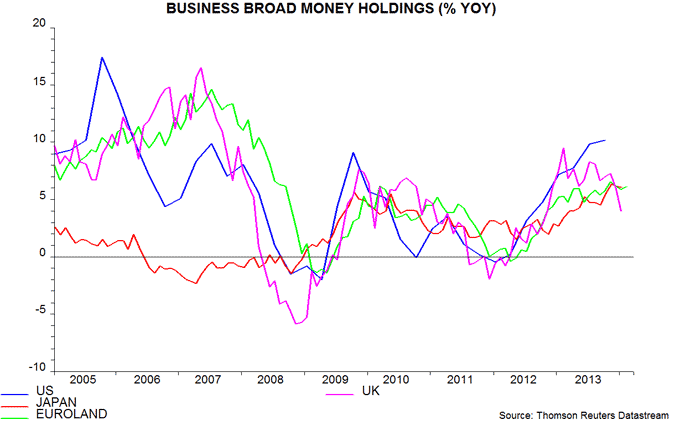
The broad monetarists have been wrong because they have ignored a reallocation of households savings away from money holdings due to near-zero deposit interest rates. Low M3 growth, therefore, has not constrained corporate liquidity or the supply of money to finance economic transactions. Corporate M3 deposits, indeed, grew by 6.1% in the year to February. Similar solid expansion of corporate liquidity is occurring in other major economies – fourth chart.
Households are likely to continue to shift funds out of the banking system, especially with ECB officials speculating about imposing a negative deposit rate, the cost of which banks would be forced to pass on to savers and / or borrowers.
The creditist bears were wrong because credit trends affect the economy only via their impact on the money supply. Lending contraction has not prevented M3 from expanding, albeit weakly, because of positive contributions from other “monetary counterparts”. In particular, the strong Eurozone balance of payments position has resulted in banks’ net external assets rising by €389 billion over the last 12 months, equivalent to 3.9% of the stock of M3.
*Notes and coin in circulation plus overnight deposits of households and non-financial corporations divided by consumer prices, seasonally adjusted.
**Country figures cover all sectors (i.e. financial as well as non-financial).
UK inflation good news approaching an end
Consumer price inflation fell from 1.9% in January to 1.7% in February, reflecting favourable effects from motor fuel costs, gas / electricity prices and clothing. This decline was expected and the forecast here remains for inflation to rise from the spring and end the year at about 2.75%. This assumes a firming of core pressures in lagged response to faster monetary growth and eroding spare capacity, and a rebound in food / energy costs.
The annual rise in food prices has slowed from 4.1% to 1.8% over the past 12 months, cutting 0.2 percentage points from CPI inflation. A surge in global food commodity prices since December, however, suggests that CPI food inflation is close to a low and will revive to 3-4% by late 2014 – see first chart*. There may be additional upward pressure from domestic supply disruption due to the recent floods.
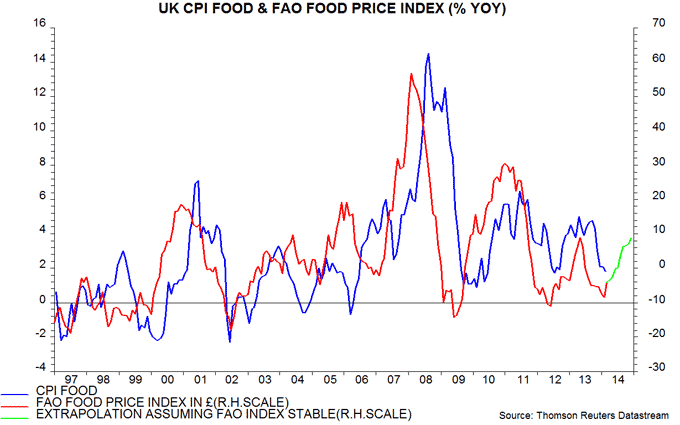
Annual energy price inflation has fallen from 4.0% to 0.6% over the past year, cutting a further 0.3 percentage points from the CPI rate. Motor fuel costs in February were 5.5% lower than a year before but are assumed to rise modestly later in 2014, as ongoing solid global economic expansion is reflected in a firmer oil price. Gas / electricity prices will be restrained by recent government initiatives but may still increase by about 5% over the course of 2014. The forecast here assumes that energy inflation returns to about 4% by end-2014.
“Core” CPI inflation, i.e. excluding energy and unprocessed food and adjusted for changes in VAT and undergraduate tuition fees, was 1.9% in February, unchanged from October but down from 2.5% a year before. Trends in core inflation have followed monetary growth with a lag of about two years, in line with the monetarist rule – see previous post and second chart. This relationship suggests that the core rate is bottoming and will rise over the remainder of 2014 – the forecast assumes a return to 2.5% by year-end.
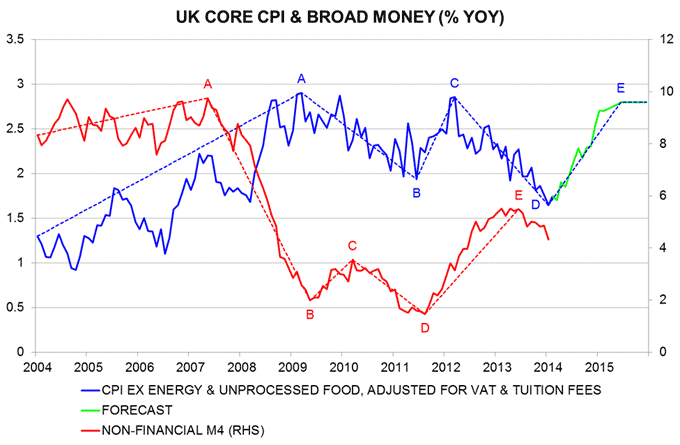
The forecast could be undershot if sterling rises further, particularly against the dollar. The US economy, however, may surprise positively in mid-2014 based on recent narrow money strength – see previous post – lifting interest rate expectations and the currency.
The suggestion that inflation is bottoming is supported by the alternative RPIJ measure, based on the components and weights of the RPI and the CPI’s calculation method. This measure reached a low of 1.9% in October and was 2.0% in February.
*FAO = UN Food and Agriculture Organisation.
UK external finances sound despite current account deficit
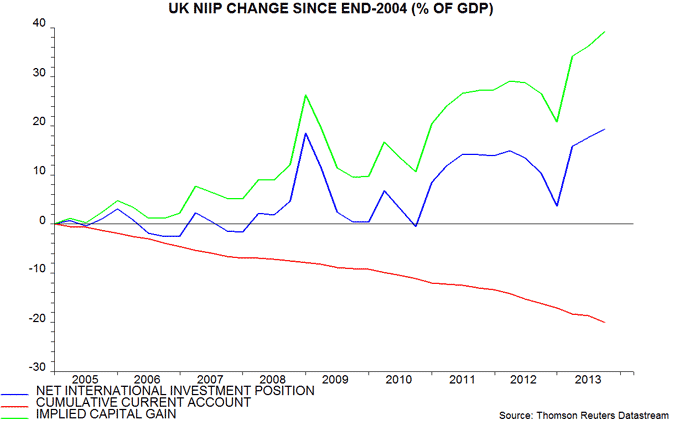
Proponents of the view that economic strength is unsustainable often cite a widening current account deficit as evidence that Britain is “living beyond its means”. This neglects a large capital gain on overseas investments in recent years; this gain has more than offset the deficit, resulting in a significant improvement in the net investment position.
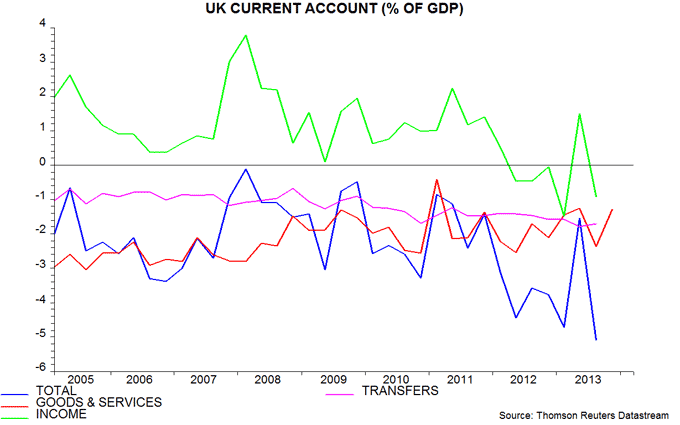
The current account deficit rose from 1.5% of GDP in 2011 to 3.8% in the first three quarters of 2013*. The current account is the sum of balances on trade in goods and services, income and transfers. The trade deficit was 1.6% of GDP in 2013, exactly in line with its long-run average**, and has been stable in recent years. The transfers deficit is also little changed since 2011. The rise in the current account shortfall reflects a shift in the income balance from substantial surplus to deficit – see first chart.
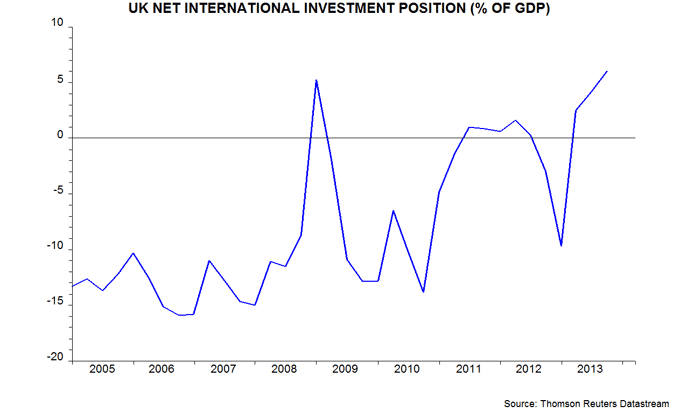
Current account deficits have a negative impact on a country’s net international investment position (NIIP), since they must be financed either by borrowing from overseas or selling foreign assets. The UK’s NIIP, however, has improved from -13% of GDP (i.e. assets less than liabilities) at end-2004 to 6% by the third quarter of 2013 – second chart. This reflects changes in capital values of existing assets / liabilities.
The 19 percentage point rise in the NIIP / GDP ratio since end-2004 compares with a cumulative current account shortfall of 20% of GDP over this period. The implied capital gain on the stock of net assets, therefore, is a whopping 39% of GDP – third chart.
Put differently, the current account position adjusted for changes in capital values has been in substantial surplus in recent years, including 2013.
A stable, modest trade deficit and rising overseas wealth support the view here that strong economic growth will be sustained. The wider current account deficit reflects a shift, probably temporary, in the form in which a return is delivered on overseas wealth from income to capital gain – only the former is counted in the current account but both should be included in an assessment of the external finances.
*Fourth quarter due on Friday 28 March. The deficit was 5.1% of GDP in the third quarter alone but this followed a low outcome – 1.5% – in the second quarter.
**Fourth quarter already available. Official data extend back to 1992.
UK Budget surprisingly creative but fiscal risks still high
With no fiscal room for manoeuvre, the Chancellor nevertheless managed to deliver a major reform of savings along with other headline-grabbing measures that will please his political supporters.
The changes to pensions and ISAs should enhance long-term economic performance by encouraging saving and promoting a more productive allocation of capital, partly by reducing “structural” flows into long-term gilts as annuity rules are relaxed.
The time-limited doubling of the business investment allowance, on the other hand, is a tinkering measure designed to give a boost to capital spending and the wider economy ahead of the 2015 election, with payback from 2016.
A further rise in the personal allowance, cuts in alcohol and air passenger duties, the higher investment allowance and energy reliefs for businesses are paid for by another attack on tax avoidance / planning, lower public sector pension costs and a positive near-term effect on receipts from the savings reforms.
The introduction of competitive National Savings bonds for pensioners from January 2015 will have the effect of tightening monetary conditions, assuming that the Bank of England has not already raised Bank rate by then. The assumption is that one-year bonds will yield 2.8%, which compares with an average rate on one-year bank instruments currently of 1.4%. The bonds will raise £10 billion, equivalent to about 4% of the household sector’s stock of time deposits. The competition is likely to force banks to improve their own rates, with a knock-on effect on interest costs for borrowers.
The Office for Budget Responsibility’s (OBR) assessment that the Chancellor is meeting his fiscal mandate rests on its judgemental assumptions that GDP was still 1.7% below its sustainable potential level at end-2013 and potential will grow by 2.1% per annum over 2014-18. The former is at odds with its statistical analysis of cyclical indicators, which suggests that the GDP / potential gap is negligible or even positive.
In a plausible alternative scenario in which potential output is 2% lower than in the central case and gilt yields 100 basis points higher, the cyclically-adjusted current budget would still be in small deficit in 2018-19, based on the OBR’s ready reckoners. The fiscal position, in other words, remains fragile and the OBR has arguably given the Chancellor too easy a ride.

