Entries from June 1, 2017 - June 30, 2017
UK corporate money pick-up suggesting investment resilience
UK corporate money growth has rebounded, suggesting a pick-up in business investment, which Bank of England Governor Mark Carney has cited as a condition for a rise in interest rates. The money numbers, indeed, may have contributed to the change of tone in Governor Carney’s latest speech: the Bank’s suite of forecasting models includes an investment relationship with corporate money and lending.
The overall monetary backdrop remains weak, with a slowdown in household money offsetting faster corporate expansion, and higher inflation squeezing real money balances. Soft consumer spending, therefore, still appears likely to drag down GDP growth despite a possible near-term investment recovery.
The first chart shows annual growth rates of nominal GDP and narrow / broad money, as measured by non-financial M1 / M4. The non-financial aggregates cover money holdings of households and private non-financial corporations (PNFCs), omitting financial sector deposits, which are volatile and largely unrelated to economic activity. Annual non-financial M1 growth peaked at 10.1% in September 2016 and fell further to 7.7% in May. Non-financial M4 growth has declined from 6.8% to 5.0% over the same period.
Turning points in annual non-financial M1 growth have consistently led those in nominal GDP growth in recent years. The latter may have peaked in the fourth quarter of 2016 and is likely to move lower during the second half of 2017.
The second chart shows the recent divergence of household and corporate (PNFC) money growth. Annual growth of PNFC M4 has risen from a low of 3.8% in November 2016 to 9.3% in May, a 14-month high. PNFC M1 growth has also rebounded.
Annual household M4 growth, by contrast, has dropped from 6.8% to 3.8% since September 2016. M1 growth has fallen by more.
Economic activity prospects are related more closely to real than nominal monetary trends. The third chart shows two-quarter / six-month changes in GDP and non-financial M1 deflated by consumer prices (seasonally adjusted), along with the household / corporate breakdown of the latter. (Narrow money outperforms broad money for forecasting purposes.) Real non-financial M1 growth has fallen significantly but stabilised in May and remains comfortably above zero, consistent with weak GDP expansion rather than stagnation or contraction.
Two additional considerations caution against gloom. First, corporate real money growth often leads the aggregate measure, suggesting a recovery in the latter. Secondly, the real money slowdown has been driven roughly equally by a fall in nominal money growth and a rise in inflation – consumer prices surged at an annualised rate of 3.8% in the six months to May. Annual inflation is likely to increase further but the six-month rate of change of prices may slow during the second half, supporting real money expansion.
Euroland money trends suggesting stable outlook
Six-month growth rates of Euroland real (i.e. inflation-adjusted) narrow and broad money declined in April / May but are in the middle of their ranges over the past three years, suggesting future GDP expansion of around the average over this period, i.e. a little under 2% annualised. This would be below expectations based on recent strong business surveys but in line with the ECB’s forecast, supporting plans to wind down policy stimulus later in 2017.
Six-month growth of real narrow money, as measured by non-financial M1 deflated by consumer prices, was 4.0% (not annualised) in May, down from a recent peak of 4.5% in March and slightly below a three-year average of 4.3% (i.e. from May 2014 to April 2017). Growth of real non-financial M3 was 1.8% versus 2.3% in March and a three-year average of 2.1% – see first chart.
Both measures are lower than a year ago, suggesting that GDP momentum is at or close to a peak. GDP rose by 1.1%, or 2.2% annualised, in the fourth and first quarters combined. With the real money growth measures close to their three-year averages, GDP expansion may fall back to around its three-year mean of 1.8% annualised.
The compiler of the purchasing managers’ surveys claims that the average level of the composite output index in the second quarter is consistent with quarterly GDP growth of 0.7%, or 2.8% annualised. The suspicion here is that surveys are overestimating current strength and will realign with the monetary signal – the PMI output index, indeed, declined in June.
The fall in the real money growth measures in April / May reflected a larger decline in nominal expansion partially offset by a slowdown in consumer prices following a surge in late 2016 / early 2017 – second chart. 
The non-financial money measures cover holdings of households and non-financial corporations. The official M1 and M3 aggregates also include deposits held by non-bank financial corporations – such deposits are volatile with fluctuations largely unrelated to economic prospects. Growth of real M1 and M3 was lower than that of real non-financial M1 and M3 during 2016, i.e. the official measures underpredicted economic strength – see third chart. The measures have converged recently.
Some monetary economists claim that ECB QE drove money growth higher, laying the foundation for recent solid economic performance. As the charts show, narrow and broad money accelerated strongly in mid-2014, well ahead of the start of QE in March 2015. The view here is that interest rate cuts and ECB lending programmes were more powerful drivers than QE.
Mirroring the experience elsewhere, the direct boost to broad money from QE has been largely offset by a deterioration in the balance of payments basic balance (i.e. much of the liquidity created has been exported) and by commercial banks shifting from buying government bonds to selling them (because the increase in their reserve holdings at the ECB due to QE has reduced their demand for safe liquid securities). The 12-month sum of the contributions of the ECB’s “public sector purchase programme” (PSPP), external banking flows and commercial bank transactions in government securities to the change in broad money M3 has risen by only €80 billion since end-2014, equivalent to a 0.7 percentage point addition to annual M3 growth (i.e. small) – fourth chart.
QE wind-down, by extension, may exert only a limited drag on monetary trends.
Data-checking economic views
Key economic views advanced in recent posts include:
- Global growth is slowing from a spring peak.
- The US economy will regain momentum by late 2017.
- Chinese monetary conditions remain growth-supportive.
- Euroland economic optimism is peaking.
Recent evidence relating to these themes is reviewed below.
Slowing global momentum
June flash PMIs released last week were mostly weaker than expected. In particular, the Euroland composite output index fell to a five-month low, with a slowdown in services activity outweighing further manufacturing strength.
Company earnings news is turning less favourable. The MSCI All-Country World Index earnings revisions ratio fell below zero in June, i.e. downgrades to company earnings forecasts outnumbered upgrades (adjusted for seasonal variation) – see first chart.
Six-month growth of world steel output, meanwhile, dropped sharply in May, suggesting that growth of industrial output peaked in April – second chart. 
Improving US prospects
This view is based on a rebound in six-month real narrow money growth since February.
The two-year swap spread correlates inversely with future GDP growth and has fallen since March, consistent with the positive monetary signal – third chart.
A sharp rise in mortgage rates in late 2016 has acted as a drag on housing demand and construction. The rise has partially reversed, suggesting that the drag will lift from late 2017 – fourth chart.
Supportive Chinese monetary conditions
Interpreting current money and credit trends is not straightforward. Annual growth of domestic bank credit has nearly halved since the start of 2016 but this mainly reflects a slowdown in lending to the government and financial sectors; growth of “total social financing” of households and non-financial enterprises, representing “real economy” fund-raising, has been broadly stable – fifth chart.
Annual narrow money growth, meanwhile, has moderated but remains much higher than in 2014-15. The provisional conclusion here is that the authorities have succeeded in reining in speculative credit while avoiding a money / lending squeeze on economic growth.
The monetary slowdown has eased inflationary pressures, supporting real money growth and giving the PBoC scope to reverse recent policy tightening – sixth chart.
Euroland optimism peaking
Optimism about economic prospects has increased but monetary trends suggest stable growth. Surveys may have been boosted by a temporary “Macron effect”, while the global backdrop is turning less favourable.
The Euroland earnings revisions ratio was positive and above the US ratio through May but both turned negative in June – seventh chart.
The Citigroup Euroland economic surprise index has fallen sharply and is expected here to turn negative over the summer, converging with a recovering US index – eighth chart.
Chinese narrow money / other data giving reassuring message
Chinese narrow money growth is holding up, suggesting that the economy will expand respectably during the second half of 2017. An earlier monetary slowdown, meanwhile, has been reflected mainly in a weakening of inflationary pressures, creating scope for the PBoC to reverse recent policy tightening.
The preferred narrow aggregate here is “true” M1, comprising currency in circulation and corporate / household demand deposits. The official M1 measure includes only corporate deposits; household deposits are relevant for assessing consumer spending prospects.
Six-month growth of true M1 surged in 2015-16, resulting in a forecast here that the economy would reflate in 2016-17 – contrary to a bearish consensus at the time. Six-month growth of nominal industrial output (i.e. output volume multiplied by producer prices) rose strongly from late 2015 to a peak in March 2017 – see first chart. Other evidence of reflation included accelerating house prices and strong profits expansion. 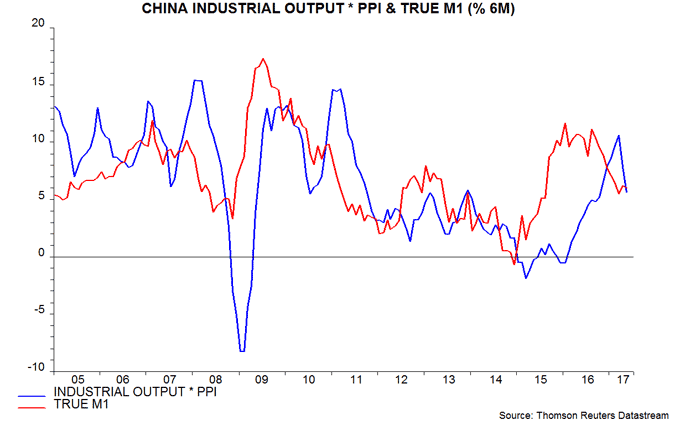
The normal pattern is for faster money growth to be reflected first in a rise in economic momentum, with prices accelerating later. In this case, however, the growth effect was small and the inflation effect large and rapid. Six-month growth of industrial output volume rose from 3.0% (not annualised) in December 2015 to a peak of 4.5% in March 2017, while the six-month change in producer prices (seasonally adjusted) surged from -3.3% at end-2015 to +6.4% in February 2017 – second chart.
The apparently small pass-through to economic activity may reflect “smoothing” of the official output data, i.e. the earlier weakness of the economy was understated, resulting in a less impressive subsequent rebound. Indirect activity gauges such as electricity consumption and rail freight traffic suggest a stronger growth pick-up since late 2015.
Six-month true M1 growth fell significantly between August 2016 and March 2017 but recovered in April / May and is much higher than in 2014 / early 2015. Three-month growth has revived from a low in December – third chart. The monetary slowdown has already been reflected in a sharp deceleration of producer prices, which fell month-on-month in April and May. The rapid pass-through to prices is supporting real money growth, in turn suggesting that the economy will expand respectably through late 2017.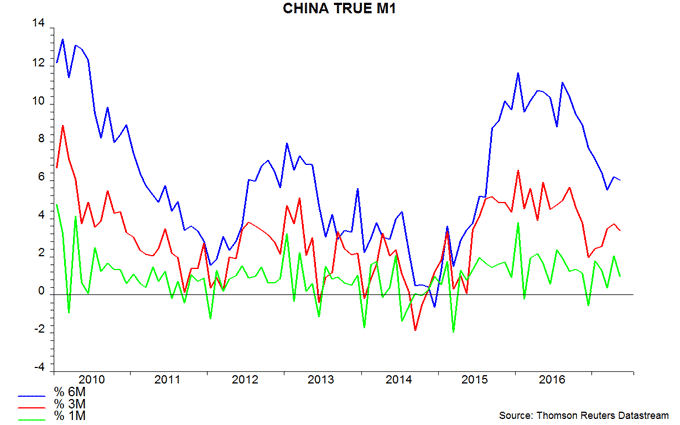
The rise in market interest rates during the first half – three-month SHIBOR is up by 140 bp – could lead to a further monetary slowdown over the summer, with negative economic implications for early 2018. The rapid easing of inflationary pressures, however, gives the PBoC scope to reverse course to pre-empt any significant weakness.
Other recent evidence supports the view that the economy retains momentum. Measures to discourage property speculation have slowed price gains but housing sales and starts are still rising year-on-year – fourth chart.
Growth of enterprise bank deposits and industrial profits has cooled but remains solid, supporting prospects for private fixed asset investment – fifth chart.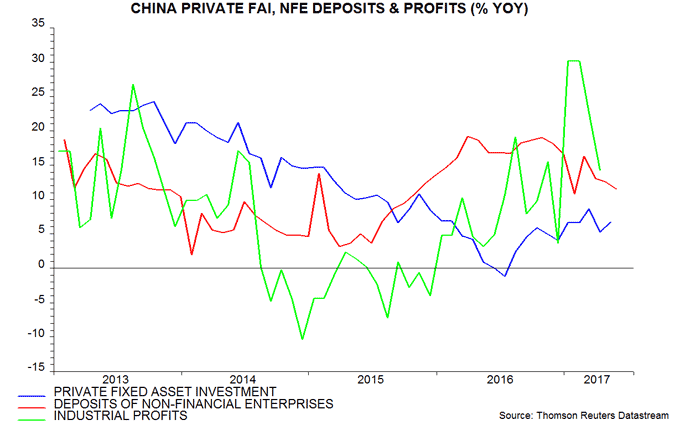
The PBoC’s second-quarter surveys of entrepreneurs and bankers, meanwhile, showed further rises in confidence, to the highest levels since 2013-14 – sixth chart.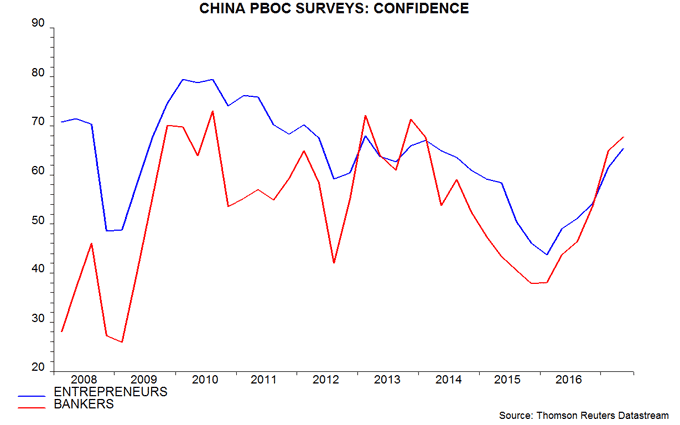
Some caveats to consensus UK economic gloom
Recent UK data and the election result have increased pessimism about economic prospects. A sober view is warranted but not all recent news has been negative.
Industrial and construction output numbers for April, released last Friday, were weak – 0.4% and 1.5% respectively below first-quarter averages. This caused analysts to scale back forecasts for second-quarter GDP growth.
An accompanying report, however, on services turnover was more encouraging, though received little attention. The turnover survey is an important input to services output, for which an April number will be released on 30 June. Adjusted for seasonals and estimated inflation, turnover rose solidly in April – see first chart. 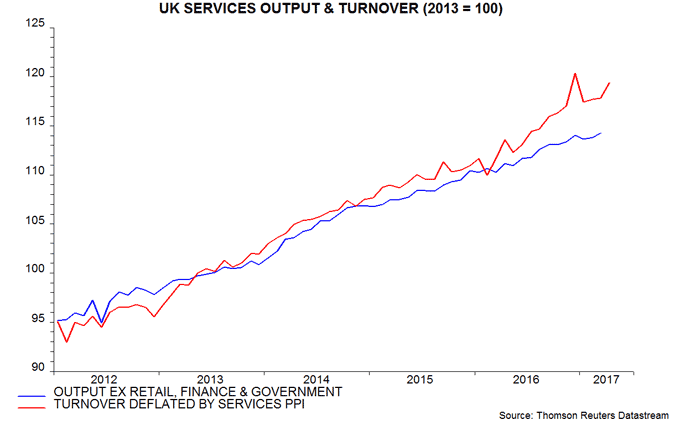
The retail sector is not covered by the turnover survey. It will contribute +0.17 percentage points (pp) to the monthly change in services output in April, since retail sales volume rose by 2.5% and retailing has a 7.1% weight. (There will be a -0.08 pp contribution in May, based on yesterday’s news that sales volume fell by 1.2% last month.)
A monthly rise in services output of as much as 0.5% in April does not look unreasonable based on these indications. If realised, the implied level of GDP in April – taking into account the weak industrial and construction data – would be 0.4% above the first-quarter average. GDP, that is, would be on course to expand respectably in the second quarter, following first-quarter growth currently reported at only 0.2%.
Negative commentary has also focused on this week’s news of an intensifying real wage squeeze, with consumer price inflation up to 2.9% in May but annual growth of average weekly earnings down to 2.1% in the three months to April – second chart.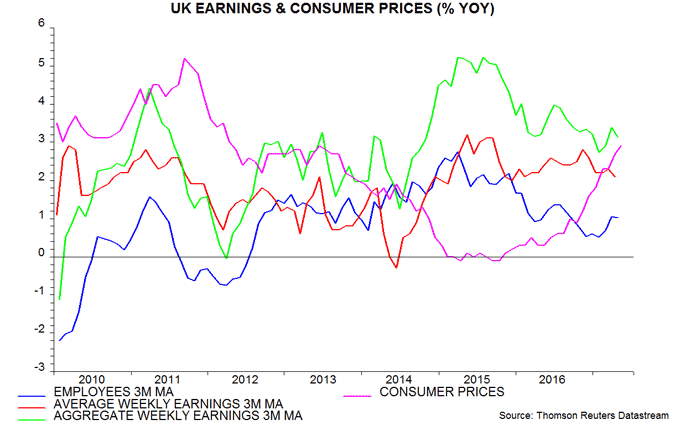
Aggregate employee earnings, however, are still rising faster than prices, reflecting solid growth in employee numbers – up by 1.0% in the three months to April from a year before. Aggregate earnings rose by an annual 3.1% in the latest three months. They lagged prices significantly during the last inflation spike in 2011, when employee numbers fell.
Monetary trends are signalling a second-half economic slowdown, with six-month growth of real narrow money falling since late 2016 – third chart. The corporate component, however, is holding up, suggesting that businesses still expect to increase investment and jobs; corporate (i.e. PNFC*) real narrow money has contracted before recessions historically. The drag from consumer spending weakness, meanwhile, may be partly cushioned by a slowdown in imports.
*PNFC = private non-financial corporations.
Global money trends suggesting late 2017 growth rebound
Global economic growth appears to be moderating, consistent with the forecast here of a summer slowdown from a spring peak. Monetary trends, however, are improving, suggesting that the slowdown will prove temporary and growth will bounce back in late 2017.
Evidence of a loss of momentum includes falls in the Citigroup G10 economic surprise index, which is now negative, and the MSCI World earnings revisions ratio (i.e. the net percentage of upgrades to earnings forecasts for MSCI World constituents). The revisions ratio correlates with the global (i.e. G7 plus E7) business survey indicator tracked here, which appears to have peaked in February / March and may subside further in June – see first chart. 
The forecast that the slowdown will extend over the summer, and possibly beyond, is supported by a global leading indicator derived from the OECD’s country leading indicators. Six-month growth of this indicator fell again in April, having peaked in January. Its average lead time with respect to industrial output historically has been 4.5 months, suggesting that six-month output growth is at or past a peak and will decline through August / September – second chart.
The economic slowdown was first signalled by a decline in six-month growth of global real (i.e. inflation-adjusted) narrow money from a peak in August 2016 – the average lead time from real money to output is nine months. Weakness was magnified by India’s demonetisation programme but growth fell significantly even stripping out the India drag, with the decline extending into February 2017 – third chart.
The adjusted real money growth measure, however, rebounded in March / April, with partial data suggesting a further solid increase in May. India is now boosting the headline number – M1 has retraced 80% of the demonetisation-related decline. Money trends, therefore, are signalling that the global economy will regain momentum in late 2017 / early 2018.
A strong pick-up in US real narrow money growth, discussed previously, has been the key driver of the rebound in the global measure. Japanese growth has also firmed, while Chinese growth has stabilised after moderating in late 2016 / early 2017 – fourth chart.
The US monetary turnaround casts doubt on recent commentary expressing pessimism about economic prospects based on a negative “credit impulse”. The credit impulse (i.e. the rate of change of credit growth) has had a variable relationship with economic activity historically and is typically coincident rather than leading. Commercial bank loans and leases rose in April and May after stagnating over the prior four months – fifth chart. The impulse, that is, may be turning positive, consistent with the earlier positive signal from money trends (which usually lead credit).
The main risk to the scenario of global reacceleration from late 2017 is a further slowdown in Chinese real narrow money in response to recent policy restriction, i.e. a loss of Chinese economic momentum could offset the expected US pick-up. The Fed, however, is now downplaying global developments in its policy decisions; it would be likely to proceed with its tightening plan unless Chinese cooling triggered a significant “risk-off” move in markets.

