
Entries from June 1, 2016 - June 30, 2016
UK growth surprising positively, as suggested by money trends
 Simon Ward
 Post a Comment
A post in March suggested that the UK economy was reaccelerating, contrary to mounting consensus gloom at the time. An upbeat view seemed justified by a rise in real narrow and broad money expansion in late 2015 / early 2016 and was judged to be consistent with incoming economic data – excepting the widely-watched but historically-unreliable purchasing managers’ surveys.
The notion that economic growth has picked up is gaining credence, following recent upside surprises in a range of series including industrial / construction output, retail sales and the labour force survey unemployment measure. According to the FT, “The data have boosted hopes that economic growth will come in far stronger than expected in the second quarter.”
Services turnover for April released today continues the pattern. The turnover survey is an important input to the services output index, which accounts for 79% of the output-based measure of GDP. Real turnover* is estimated here to have risen strongly in April – see chart.
A post last week noted that a 0.2% rise in services output in April would imply that GDP for the month was 0.4% above its first-quarter average, given previously-reported strength in industrial / construction output (ignoring any revisions to prior data). A 1.9% increase in retail sales volume in April, however, will contribute +0.2 of percentage point to services output and the turnover result suggests an additional boost from other industries. A 0.4% monthly rise would lift GDP to 0.6% above its first-quarter level.
The strength in some April series may partly reflect the early timing of Easter this year, implying a possible reversal in May / June. A Brexit vote could abort the recent pick-up if it leads to corporate retrenchment – corporate narrow money trends, discussed in Tuesday’s post, should be informative about any such effect. A win for Remain, however, would probably be followed by a significant upgrade to consensus growth expectations.
*Total ex. wholesale trade turnover, deflated by services producer prices, seasonally adjusted.
US corporate finances improving, supporting growth rebound
US corporate financing needs fell modestly in the first quarter, a development consistent with the view here – based on monetary trends – that the economy will regain momentum during the second half of 2016.
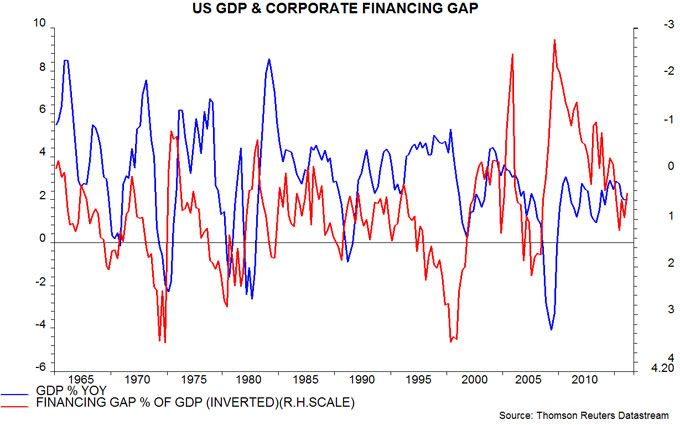
The Fed’s quarterly financial accounts show that the “financing gap” of non-financial corporations – defined as the difference between their capital spending and domestic retained earnings – was 0.5% of GDP in the first quarter, down from 1.0% in the fourth quarter of 2015 and a peak of 1.2% in the second quarter of last year.
The financing gap is an inverse long leading indicator of the economy, probably because unanticipated changes in financing needs cause companies to alter spending and employment plans. The seven US recessions over the past 50 years were preceded by a rise in the financing gap to more than 1.5% of GDP – see first chart.
The fall in the financing gap in the first quarter was mainly due to a further reduction in capital spending (i.e. fixed investment plus stockbuilding). In addition, however, domestic profits recovered slightly after significant weakness during the second half of 2015 – second chart*.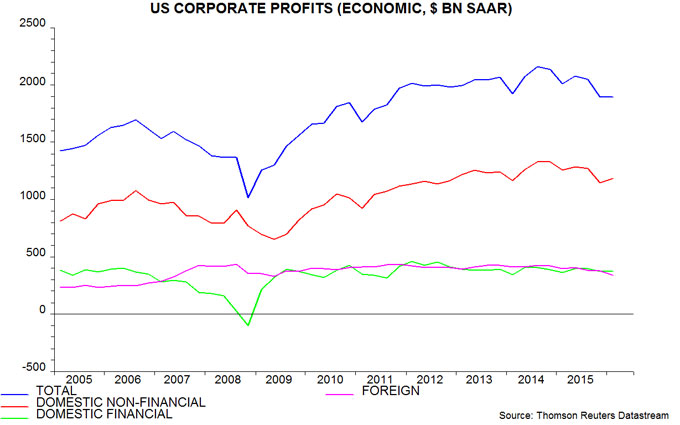
The profits recovery may continue in the current quarter. The energy sector accounted for more than half of the fall during the second half of 2015 and the spot WTI oil price has averaged $46 a barrel so far in the second quarter versus $33 in the first. Productivity performance appears to have improved, relieving upward pressure on unit labour costs: the Atlanta Fed’s “nowcast” for GDP growth in the second quarter is currently 2.8%, implying a 0.7% non-annualised gain, while aggregate hours worked by private non-farm employees rose by only 0.1% April / May compared with the first-quarter average.
Foreign profits, meanwhile, will benefit from a positive translation effect from the weaker US dollar: the Fed’s trade-weighted index against other major currencies has averaged 89.5 so far in the second quarter versus 93.2 in the first, a 4.0% decline. (Foreign profits, however, enter the financing gap calculation only to the extent that they are repatriated.)
While corporate financing needs for operational purposes have declined, companies borrowed heavily to finance share buy-backs and cash takeovers in the first quarter. Equity buying net of issuance rose to 3.9% of GDP, the highest since the third quarter of 2011.
As expected given softer labour market news and the UK EU referendum, the Federal Open Market Committee (FOMC) was yesterday non-committal about the timing of another rate rise. The median expectation of the 17 meeting participants is still for two quarter-point increases by end-2016 but six now foresee a single rise versus one in March. The view here remains that the economy is on a firming trend and a move in September is plausible, unless the current “risk-off” phase in markets is sustained.
*”Economic” profits incorporate inventory valuation and capital consumption adjustments to reported profits.
UK household / corporate money trends diverging
Previous posts expressed optimism about UK economic prospects based partly on solid money / credit trends. GDP is currently estimated to have risen by 0.4% in the first quarter and April data for industrial / construction output and retail sales suggest a respectable start to the current quarter – see Friday’s post.
Six-month growth of real narrow money, as measured by non-financial M1, was stable in April at its highest level since December 2013. This stability, however, conceals a further pick-up in household real M1 expansion offset by a sharp slowdown in holdings of private non-financial corporations (PNFCs) – see chart.
Corporate narrow money numbers are volatile and the April weakness may prove temporary. It may, however, indicate that firms are reining back expansion plans, perhaps because of EU referendum uncertainty. Corporate money sometimes leads household / aggregate trends, e.g. before the 2008-09 recession. Household M1 buoyancy suggests solid consumer spending / GDP growth over the summer / autumn but confirmation of a corporate money slowdown would raise doubts about economic prospects for late 2016 / early 2017.

Solid UK activity data at odds with survey pessimism
UK industrial and construction output numbers for April released this week cast doubt on the widespread view that economic growth has slowed. This view rests mainly on weaker business surveys that may have been “contaminated” by Brexit uncertainty.
Industrial output surged by 2.0% in April while construction output rebounded by 2.5% after a 3.7% March decline. The two sectors account for 21% of gross value added (GVA). April output for the dominant services sector will be released on 30 June. If it were to rise by 0.2%, in line with the average monthly increase over the last 12 months, the monthly GDP proxy tracked here would grow by 0.6%, to stand 0.4% above its first-quarter level – see first chart.
GDP growth in the second quarter, that is, would be on course to match or exceed a 0.4% first-quarter gain. Most economists, by contrast, expect GDP to slow, or even stagnate, in the current quarter.
Retail turnover is a component of services output and has already been reported to have risen by 1.3% in April, implying a contribution of +0.1 of a percentage point to the monthly output change.
The strength of these April activity series after relative weakness in March may partly reflect seasonal adjustment problems due to the early timing of Easter this year.
Previous posts (e.g. here) expressed optimism about UK economic prospects based partly on solid money / credit trends. Six-month growth of real (i.e. consumer-price-deflated) narrow money, as measured by non-financial M1*, was stable in April at its highest level since December 2013 – second chart.
*Notes / coin and sterling sight deposits of households and private non-financial corporations.
Global leading indicators confirming positive monetary signal
The forecasting approach here uses non-monetary leading indicators to confirm signals from narrow money trends. Both are now giving a strongly positive message for global economic prospects.
The OECD yesterday released April data for its country composite leading indicators. A recovery in the US indicator was confirmed – see Tuesday’s post – while a number of other countries also registered a significant improvement.
The first chart below shows a “global” leading indicator calculated by combining data for the G7 and emerging E7 countries. The six-month and one-month changes in the indicator strengthened further in April. A cyclical upswing in the indicator is clearly now under way.
A study* of G7 data since the 1960s showed average lead times of real narrow money and the leading indicator with respect to industrial output of nine and six months respectively. The six-month change in global real narrow money bottomed in August 2015, with that of the leading indicator following in November – consistent with the historical three-month gap. The suggestion is that the six-month change in industrial output will recover from May, rising at least through October (based on the leading indicator) or January 2017 (based on monetary trends). 
Both the G7 and E7 leading indicator components have turned up convincingly – third chart. The E7 pick-up is more impressive, reflecting recoveries in Russia and Brazil as well as China, and further strength in India.
Real narrow money and the leading indicator signal cyclical direction rather than the level of economic growth. The breadth of improvement in monetary and leading indicator trends across countries, however, suggests the potential for a significant positive growth surprise in late 2016.
*Available on request.
UK monetary data suggesting capital / sterling outflow
A Bank of England data series* measuring the impact of “external and foreign currency flows” on the M4 money supply suggests that investors have moved funds out of the UK and / or sterling since late 2015, probably because of the EU referendum.
The numbers are highly volatile on a monthly basis but show an outflow of £77 billion in the six months to April, up from £2 billion in the previous half-year and the largest since 2012 – see chart.
The item “external and foreign currency flows”, or equivalently “monetary financial institutions’ (MFI) externals”, measures the combined change in the banking system’s net external asset position and its net foreign currency lending to UK non-banks. The change in net external assets, as a matter of accountancy, equals the sum of the balance of payments current account and the capital account of UK non-banks. A fall in net external assets, therefore, indicates a deficit on the current and non-bank capital accounts.
A fall in banks’ net foreign currency lending to UK non-banks, meanwhile, implies that non-banks have reduced their exposure to a decline in sterling.
The current account deficit was £33 billion in the fourth quarter of 2015. Assuming that it has remained stable, the implied shortfall over six months is £66 billion – below the £77 billion external and foreign currency outflow in the six months to April. This suggests that the non-bank capital account moved into deficit over this period and / or UK non-banks cut their net foreign currency borrowing from UK banks.
The claim that foreigner investors have reduced their exposure to the UK is supported by the May Bank of America / Merrill Lynch global fund manager survey, showing a net 36% of asset allocators underweight UK equities – the largest negative balance since November 2008.
*Bankstats Table 3.2, series identifier VRIG or ABVW.

