
Entries from June 1, 2016 - June 30, 2016
UK corporate money signalling rising caution pre EU referendum
 Simon Ward
 Post a Comment
UK corporate money trends have weakened since late 2015, consistent with companies putting expansion plans on hold pending the result of last week's referendum.
Corporate money (i.e. held by private non-financial corporations, or PNFCs) will be a key indicator for assessing whether the referendum shock will push the economy into a recession. Corporate money leads business investment and overall activity, probably because companies adjust their liquidity position to reflect their spending / hiring plans. Real (i.e. inflation-adjusted) corporate money contracted before the 1979-81, 1990-91 and 2008-09 recessions, as well as the 2011-12 “double-dip” slowdown.
The first chart shows six-month growth rates of real corporate narrow money M1 and broad money M4, along with the two-quarter change in GDP*. Both measures were strong last autumn, consistent with recent “hard” data suggesting solid GDP expansion during the first half of 2016, allowing for a typical nine-month lead from money to activity.
The six-month change in real corporate M1, however, has fallen significantly since February, while that of real M4 has turned slightly negative. M1 is preferred here for forecasting purposes: it is closer to the concept of "transactions money" and appears to work better empirically. An example of the superior performance of real M1 was its mild contraction before the 2011-12 slowdown; a much larger fall in real M4 seemed to predict a recession. The recent decline in real M1 growth suggests that companies were planning for slower expansion but not a fall in activity before the referendum.
Weakening corporate money growth contrasts with strengthening household trends. Six-month growth of household real M1 and M4 rose to 15- and nine-year highs respectively in May, suggesting solid near-term consumer spending prospects – see second chart. Household income and money growth, however, may slow as companies curb expansion plans and hiring. Corporate money often leads household trends: corporate real M1 contracted before household real M1 ahead of the 2008-09 recession.
The base-case assumption here is that increased uncertainty due to the referendum shock will subtract 1.0-1.5 percentage points from GDP growth over the next 12 months, implying a significant slowdown rather than a recession. This view will be revised negatively if corporate real M1 contracts over coming months.
*M1 = notes / coin + sterling sight deposits. M4 = M1 + sterling time deposits, short-term bank bonds and repos.
UK corporate money trends key for assessing recession risk
The EU referendum result will have a negative impact on UK economic prospects but there is little basis, at present, for assessing the magnitude of the effect.
The negative impact will occur through two key channels: an uncertainty effect on business investment and hiring, and a possible tightening of financial conditions.
The uncertainty effect alone is probably insufficient to trigger a recession. GDP was judged here to be growing at a rate of about 2.25% per annum before the shock, based on monetary trends and the most recent “hard” data. A 10% cut in private investment over the next 12 months relative to previous plans – possibly an aggressive assumption – would subtract 1.4 percentage points from GDP growth, i.e. insufficient to push the economy into contraction.
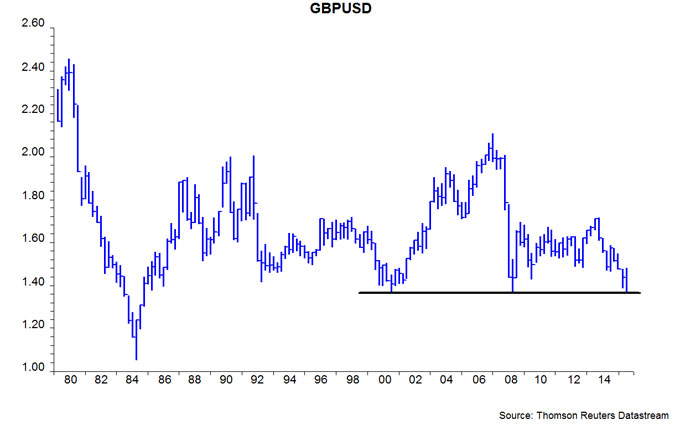
Financial conditions could tighten significantly but have yet to do so. Corporate bond spreads remain contained – see first chart – and equities have yet to breach their February low in sterling terms. The Bank of England, moreover, is likely to deliver a precautionary easing move by August. The exchange rate has so far taken the strain of the referendum result, with the sterling-US dollar rate falling to the mid-1.30s for the third time in 15 years – second chart. 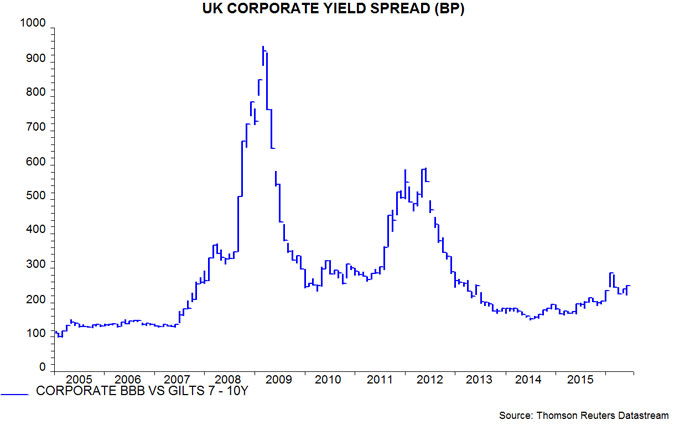
Assuming no significant change in financial conditions, a reasonable base case is that GDP growth over the next 12 months will be 1.0-1.5 percentage points lower than otherwise. So, for example, 2017 growth could be 1% instead of 2.25%.
The approach here will be to adjust this base case forecast depending on corporate money trends, which should give early warning of any major retrenchment. Corporate real narrow money M1 has contracted before recessions historically, also weakening before the 2011-12 slowdown – third chart. Six-month growth fell in April, possibly reflecting pre-referendum caution; May data will be released on Wednesday.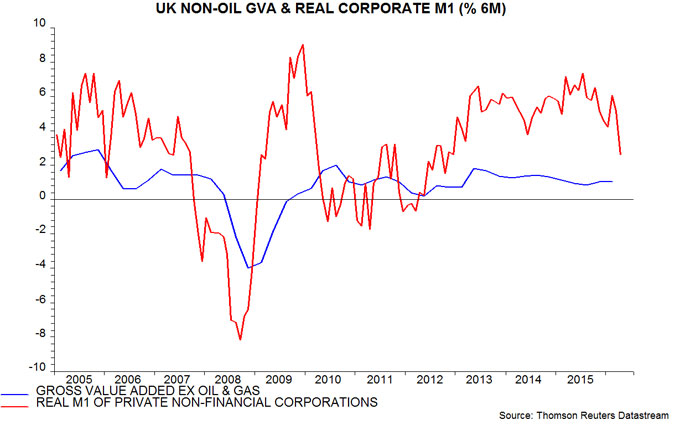
The direct spillover effect of UK economic weakness on the rest of the European Union will be minor: exports to the UK account for only 3% of rest of EU GDP. The much bigger risk, again, is financial contagion. Monetary trends, as in the UK, were giving a positive signal for economic prospects before the shock: real non-financial M1 growth, and its corporate component, remained strong in May – fourth chart.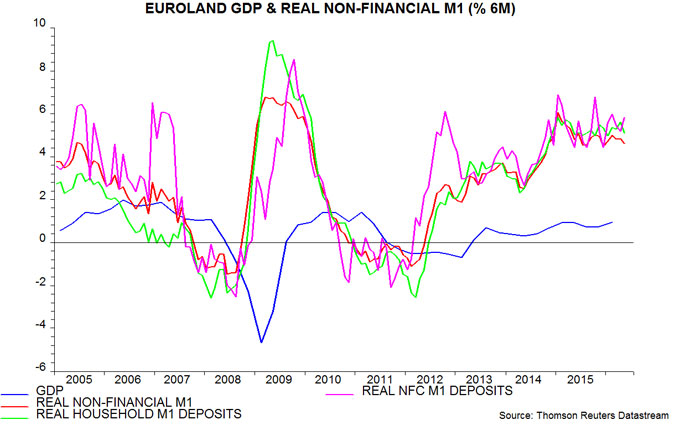
Recent data are consistent with the view here that US / Chinese economic growth is picking up at mid-year; the latest quarterly PBoC survey of enterprises, for example, reports an improved assessment of orders – fifth chart. The direct global impact of weaker UK / European prospects will be small and offset by looser central bank policies. A constructive assessment will be maintained barring a reversal of recent global narrow money strength.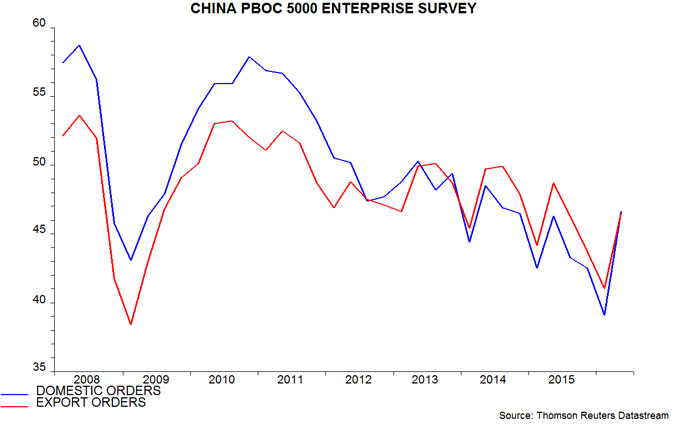
Brexit reaction: political earthquake, global economic impact limited
The UK electorate voted by a 52%-48% margin to leave the European Union, with remain leads in London, Scotland and Northern Ireland outweighed by leave victories in the rest of England and Wales. This has prompted the resignation of Prime Minister David Cameron, who will be replaced by a new Conservative leader by October, but there is no plan to hold a general election. The surprise result triggered a collapse in the pound and a violent risk-off move in global markets.
The UK and the rest of the Europe now enter a period of great political uncertainty but there is unlikely to be any change to the UK's economic and financial arrangements with the EU before late 2018. The exit procedure is governed by Article 50 of the Lisbon Treaty, which allows for a two-year period for a country to negotiate terms of departure. The new Prime Minister is expected to trigger Article 50 soon after assuming office.
The rise in political and economic uncertainty will act as a drag on growth, primarily by discouraging business investment and hiring. The Treasury predicted that that the economy would enter a recession in event of a Brexit. We do not share this view because 1) recent data indicate that the economy had solid momentum before the referendum, 2) the Bank of England is likely to cut interest rates on any signs of weakness and 3) the lower level of the pound should stimulate net trade (although higher import prices will dampen consumer spending).
The UK decision will encourage anti-EU politicians in other countries but we judge it unlikely that it will trigger copycat referenda, let alone the exit of another member state. It may, indeed, cause Eurozone countries to press on with deeper economic and political integration. The EU leadership is likely to pursue a tough line in negotiations with the UK to deter other countries from considering an exit, particularly in view of French and German elections due in 2017.
The UK accounts for 2.3% of global GDP measured at “purchasing power parity”, with the current EU as a whole at 16.7%. The direct global implications of any uncertainty-related slowdown in UK / European growth are minor. The bigger risk is that the Brexit shock leads to a sustained risk-off episode in markets that feeds back into weaker demand. This is not our central scenario because: 1) the US and Chinese economies appear to be regaining momentum, with monetary trends and leading indicators suggesting solid second-half prospects; 2) global liquidity remains plentiful, as evidenced by a large positive gap between real money and output growth; and 3) the Fed and other central banks are likely to ease policies in the event of significant market weakness.
Global activity firming, money signal still positive
The view here that US / global economic momentum is starting to pick up is supported by the American Chemistry Council’s chemical activity barometer. Calculated Risk has noted that this barometer usually leads US industrial output; the first chart shows that it also moves ahead of global (i.e. G7 plus emerging E7) activity. Six-month growth of the barometer in June was the strongest since August 2014.

The chemical activity barometer’s components are grouped under the headings of 1) production, 2) equity prices of chemical companies, 3) product prices and 4) inventories / other indicators. All four groupings have increased for three consecutive months.
Another sign of strengthening industrial activity is a recovery in the six-month change in world steel output, which was modestly positive in May – second chart.

The world equity analysts’ revisions ratio, meanwhile, maintained its recent higher level in June – third chart.

The UK commentariat’s claim that the economy has slowed in the run-up to the EU referendum continues to be contradicted by incoming evidence. The June CBI industrial trends survey reported strong output expectations and a rise in pricing plans, probably partly reflecting recent sterling weakness – fourth chart.

Stronger activity news is consistent with an earlier pick-up in global six-month real narrow money growth, which is estimated to have remained at its strongest level since 2011 in May, based on data covering two-thirds of the universe – fifth chart.

The sixth chart shows adjusted real money growth measures advanced by nine months – the average historical lead time between money and output. The red line adjusts for a long-run downward trend in the rate of change of the velocity of circulation; the green line additionally takes into account the slope of the G7 government yield curve. Both measures suggest a pick-up in industrial output growth into early 2017 (the final data points are for February 2017).
A reader asked whether narrow money buoyancy reflects increased cash hoarding due to low / negative interest rates, with the implication that it may not signal stronger economic activity. The answer, in general, is no. The narrow money pick-up has been driven by demand deposits, not currency holdings. Eurozone M1, for example, grew by an annual 9.7% in April, with the currency component up by 4.6% and overnight / demand deposits by 10.8%.
Would Brexit roil global markets?
A case can be made that the market impact of “shocks” depends on the state of the economy when they hit. The failure of Bear Stearns in March 2008, for example, may have triggered a negative spiral of events partly because it occurred just after the US economy had entered a recession (in January). Similarly, the severity of the 2011-12 Eurozone crisis may have reflected its interaction with a global economic slowdown, due partly to a downturn in the 3-5 year US Kitchin stockbuilding cycle.
Global economic growth has been weak but stable in early 2016 and the view here – based on monetary trends and leading indicators – is that it will strengthen during the second half. As in 2011-12, a downswing in the US Kitchin cycle has contributed to recent softness but this may be coming to an end: the ratio of business inventories to sales fell in April for the first time for 13 months and local peaks in the ratio usually occur around troughs in economic momentum.
The above view suggests that the negative impact of a Brexit vote on global markets would be smaller than many fear. It is questionable, moreover, whether such a vote would represent a “shock” as normally understood – markets are prepared for the possibility (it is a “known unknown” in Rumsfeld-speak) and there would be no change to economic / financial arrangements for a sustained period.
The UK fallout, of course, would be greater but a similar argument applies: recent data indicate that the economy has gained, not lost, momentum going into the vote and monetary trends continue to give a positive signal for prospects, suggesting that the immediate negative impact would be containable. As previously discussed, the Treasury “forecast” that a recession would ensue is circular: it assumes, arbitrarily, that economic uncertainty would rise by an amount historically associated with recessions.
Sterling would no doubt fall sharply in the wake of a Brexit vote but would it remain permanently lower? The trade deficit in goods and services was a modest 2.0% of GDP in 2015, unchanged from 2012, arguing against exchange rate overvaluation. The wider current account deficit – 5.2% of GDP last year – mostly reflects a shortfall on investment income but this has been more than offset by a capital gain on the external assets / liabilities position; the current account adjusted for this capital gain has recently been in surplus.
Chinese economic outlook: near-term optimism maintained
Divergent US / Chinese narrow money trends last autumn suggested that the US economy would slow in early 2016 while Chinese growth would rebound, both contrary to consensus expectations at the time – see post from September. The US leg of this forecast has played out but Chinese activity has remained lacklustre. Chinese monetary trends are still viewed here as giving a positive signal for economic prospects, with the lack of a significant pick-up to date reflecting the normal variability of the lag between money changes and activity.
Most Chinese economic series have shown stability or modest improvement in recent months. The two manufacturing purchasing managers’ indices* remain below 50 but were higher over March-May than between July 2015 and February. Annual industrial output growth has moved sideways – 6.0% in May versus 5.9% in December. Annual retail sales growth has declined from 11.1% in December to a still-solid 10.0% in May, or 9.7% in volume terms. New residential construction is rising year-on-year after falling for most of 2015 – see first chart.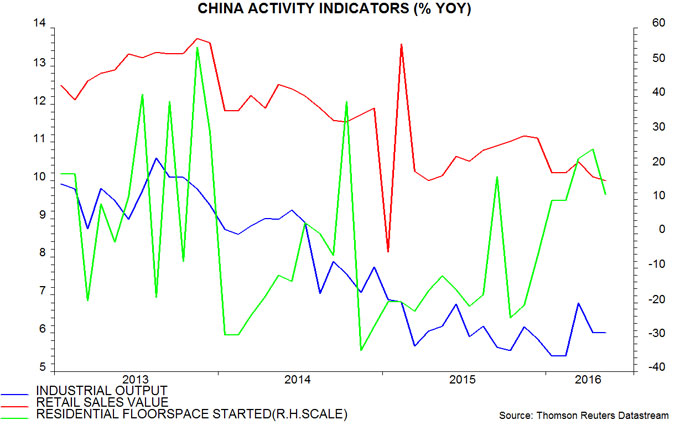
Total fixed asset investment, however, has disappointed, despite a surge in state-sponsored spending. Annual growth in private investment has continued to slow sharply, to just 1.0% in May (value terms) – second chart. This probably reflects a lagged response to profits weakness in 2015.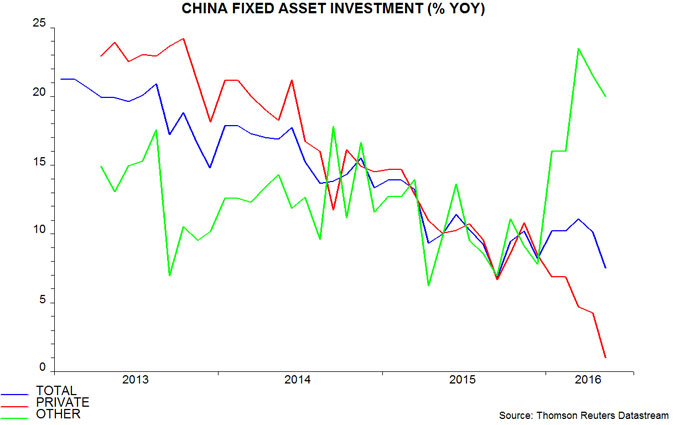
The official money measures are giving conflicting messages. Annual growth of M1 rose further to 23.7% in May, the highest since 2010, but M2 growth fell back to 11.8%, an 11-month low – third chart.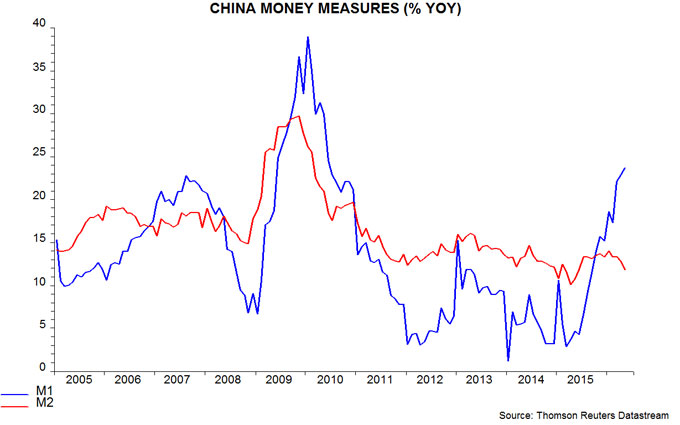
The official measures are regarded here as flawed. Chinese M1, contrary to global convention, includes only corporate demand deposits, excluding household holdings. M2, meanwhile, has been distorted in recent years by large swings in growth of financial deposits, which are of little significance for economic prospects. The preferred aggregates here are an expanded M1 measure incorporating household as well as corporate demand deposits – “true” M1 – and M2 excluding financial deposits. Annual growth of the two measures has risen significantly over the past year, i.e. they are giving a consistent positive directional signal for economic momentum – fourth chart.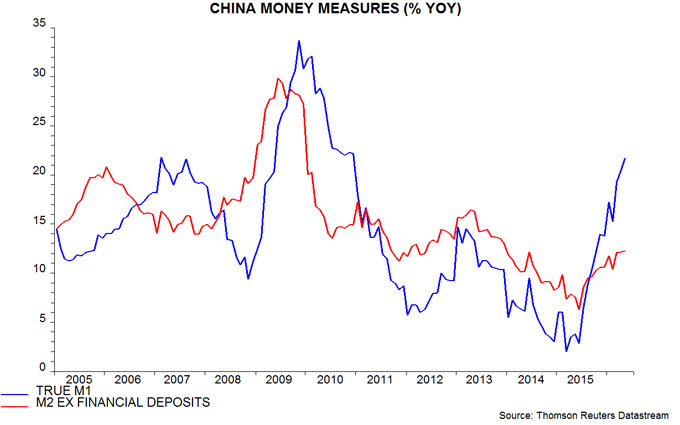
Some commentators have suggested that the relationship between narrow money and the economy has weakened or broken down. One prominent research group argued late last year that corporate demand deposits had been boosted by the local government debt swap programme; local governments, it was claimed, had passed the proceeds of bond sales to their related corporate entities, temporarily swelling the demand deposits of these entities pending their repayment of bank debt.
This “explanation” was regarded sceptically here, because detailed data showed that demand deposits of non-government-related corporations and households were also rising strongly. The failure of narrow money growth to subside in 2016 has cast further doubt on the story.
Another suggestion is that narrow money buoyancy reflects a rise in risk aversion and liquidity preference due to last year’s sharp fall in the stock market and more recent fears of a large devaluation of the exchange rate, i.e. it does not carry the usual implication of a rise in spending intentions. Stock prices, however, have stabilised since early 2016 while capital outflows have slowed significantly – any rise in narrow money demand due to increased risk aversion, therefore, should have reversed.
The view here is that the lack of a significant pick-up in economic growth to date reflects the normal variability of the lag in the relationship between money changes and activity. A study of G7 data over the past 50 years showed that turning points in narrow money preceded those in industrial output by nine months on average but with a plus / minus one standard deviation range of five to 13 months. Chinese narrow money growth started to surge in July 2015; the lack of a significant activity response by May 2016, 10 months later, is well within the bounds of historical experience.
The view that an economic pick-up is imminent is supported by a strengthening of several series that usually respond to monetary changes with a shorter lag than activity data. The annual rates of change of house prices and profits, for example, have risen since late 2015 – fifth chart. The pick-up in such “intermediate” variables is evidence that the monetary transmission mechanism is working normally. The recovery in profits, and continued corporate narrow money strength, suggest that the annual change in private investment is at or near a low.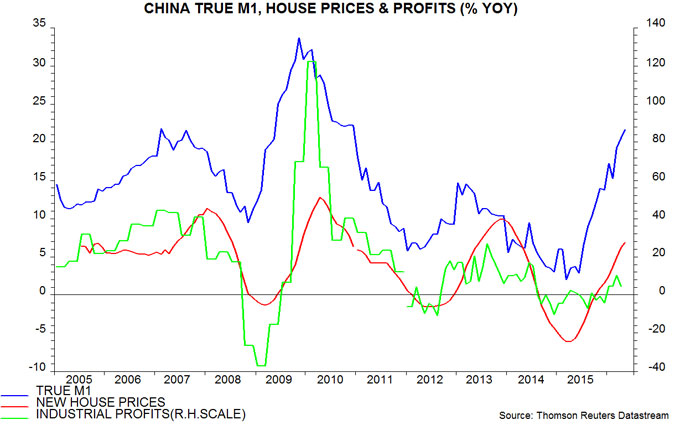
The OECDs composite Chinese leading indicator – which excludes monetary variables – provides further corroborating evidence of an improving outlook. The “ratio-to-trend” version of the indicator rose in March / April after a sustained fall between late 2013 and early 2016, implying a recovery in economic growth from below- to above-trend – sixth chart.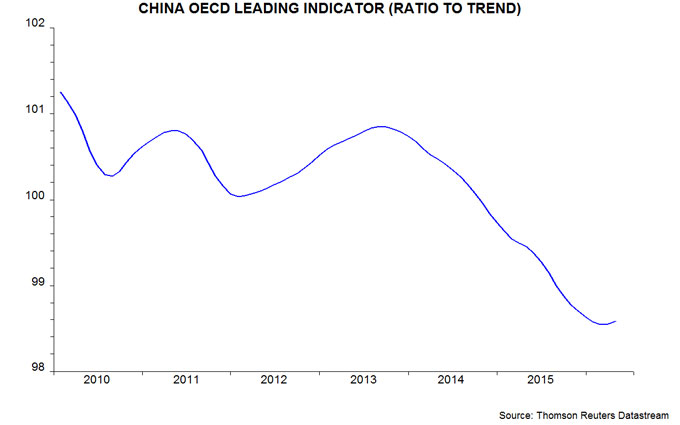
*National Bureau of Statistics and Markit / Caixin.
