Entries from July 1, 2014 - July 31, 2014
UK inflation firming on schedule
Previous posts extending back to last summer argued that the trend in UK inflation would shift from down to up in spring 2014 in lagged response to faster monetary growth and associated economic strength. The higher-than-expected June number reported today is consistent with the forecast but recent volatility suggests waiting for July data before concluding that the trend has turned.
Annual consumer price inflation fell from 1.8% in April to 1.5% in May but rebounded to 1.9% in June. Some commentators argue that the June rise is a blip that will be reversed in July; the preferred view here, by contrast, is that May was the outlier, with June representing a return to trend.
“Blip” proponents attribute the June rise to a delayed start to summer sales, particularly for clothing and footwear. Annual clothing and footwear inflation of 2.4% in June, however, compares with an average of 1.3% over the prior 12 months. Even if all of this difference reflects a sales timing effect, the implied boost to CPI inflation is less than 0.1 percentage points*.
The focus here is on “core” inflation, i.e. excluding energy and unprocessed food and adjusted for VAT changes and the 2012 jump in undergraduate tuition fees. This rose to 2.0% in June, the highest since September. The chart below, an update from a post in August 2013, shows that major turning points in core inflation over the past decade have followed trend changes in broad money expansion roughly two years earlier, consistent with the Friedmanite rule. The rule suggests a further move higher through early 2015, at least.
*Clothing and footwear has a 7.1% weight in the CPI basket.
Chinese money trends signalling solid H2 economy
Chinese monetary statistics for June suggest that economic growth will rise through end-2014.
A post two months ago noted that monetary trends had turned positive and were signalling a summer revival in economic momentum, following a slowdown in early 2014. This forecast has received support from stronger purchasing managers’ surveys in May and June and should be confirmed by June industrial output released tomorrow.
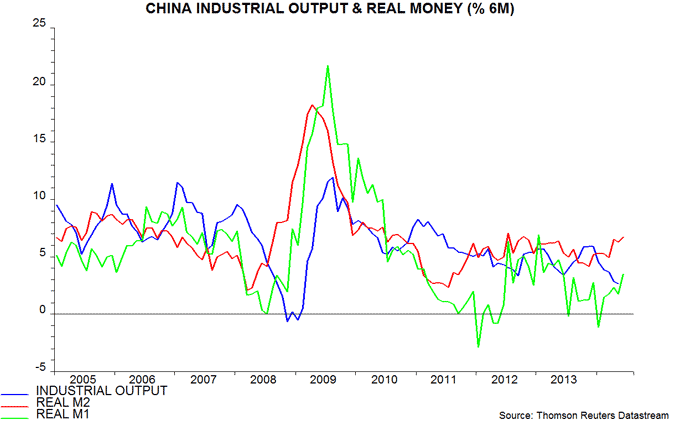
The monetary backdrop, meanwhile, has improved further: six-month expansion of real (i.e. inflation-adjusted) M2 and M1 rose to 20- and 13-month highs respectively in June – see first chart. Allowing for the typical half-year lead, the economic growth upswing should last through end-2014, at least.
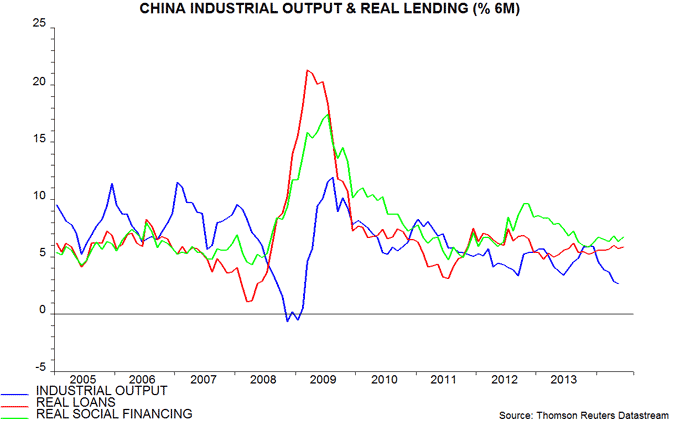
Real credit trends have also firmed modestly, although the broad “total social financing” measure is still growing more slowly than a year ago – second chart.
The monetary pick-up partly reflects policy easing in response to a softening property market and below-target inflation – market interest rates have been on a gently declining trend since end-2013. Policy-makers may move to the sidelines if the economy firms as expected and house price inflation stabilises – likely based on the historical relationship with monetary trends.


Japanese economic outlook still weak, based on money trends
Recent Japanese economic news has mostly disappointed. Real consumer spending recovered by only 1.3% in May after an 8.1% drop in April. Core machinery orders plunged 17.4%, to a 15-month low. Export volumes were down 2.2%, still failing to benefit from a lower yen.
Monetary trends have been suggesting economic weakness. Six-month nominal growth of narrow and broad money has fallen sharply since end-2013, with the decline extending last month – see chart. The aggregates have contracted in real terms, reflecting the inflation impact of April's sales tax hike.
Annual growth in broad money M3, 2.4% in June, is back to the level prevailing before incoming Bank of Japan (BoJ) Governor Kuroda launched his mega-QE experiment in April 2013. On a monetarist interpretation, therefore, the experiment has flopped. As previously explained, the BoJ has, in effect, engaged in a JGBs / reserves swap with the banks, with no impact on the size of their balance sheets or the wider economy.
Current monetary trends suggest that economic news will continue to challenge optimists, although exports should benefit near term from stronger global activity. Stock market bulls, meanwhile, are pinning their hopes on the Government Pension Investment Fund (GPIF) raising its allocation to domestic equities, selling bonds to the BoJ to fund the switch. This would amount to QE shifting from JGBs to equities by the back door.
The GPIF, however, could delay the execution of any such policy change. Why should it assume the role of “greater fool” by buying equities at prices inflated by front-running by foreign hedge funds and other speculators? Its managers, whose heavy bond weighting has paid off, can afford to be patient, spreading purchases over years and timing them to take advantage of market weakness.
Global lead indicators / real money hinting at end-Q3 growth peak
Global leading indicators followed here continue to signal a summer economic rebound but suggest that growth will level off or moderate later in 2014.
The indicators are designed to give advance warning of turning points in global industrial output momentum. Short- and longer-term measures are calculated, with average lead times of 2-3 and 4-5 months respectively in recent cycles.
The short-term leading indicator rose again in May while the longer-term measure fell marginally for a second month, following a sharp gain between December and March. The message is that six-month global industrial output growth will rebound from an expected May low but may level off or retreat slightly at the end of the current quarter – see first chart. Note that prior falls in the indicators correctly signalled recent output weakness.
The recent small decline in the longer leading indicator fits with a minor slowdown in six-month global real narrow money expansion since February – second chart. Real money trends typically lead output by about six months.
The level of global real money growth remains consistent with solid economic expansion. The current global reading, however, is reliant on US strength, with real money growth slowing in the rest of the G7 and moderate / trendless across the E7 large emerging economies – third chart. Near-term global economic prospects are positive but faster growth may not be sustained unless non-US monetary trends improve.
*Global = G7 developed and E7 emerging economies.


Should investors chase frontier markets?
The MSCI frontier markets index has risen by 17.4% in US dollar terms year-to-date*, far outpacing gains of 6.2% and 6.0% respectively for MSCI’s developed and emerging markets indices. Is this a reflection of the fundamental attraction of these markets or more evidence that QE is driving excessive risk-taking?
The answer, probably, is neither. The strong performance of the frontier markets index this year has been due to outsized rises in the United Arab Emirates (UAE) and Qatar as fund managers bought the two markets ahead of their promotion to the MSCI emerging markets index at end-May. Stripping out the UAE and Qatar, frontier markets have risen by 6.0% year-to-date, matching gains in developed / emerging equities.
Anyone riding the UAE / Qatar buying wave needed to jump off before the transfer took place. The two markets have slumped by 17.6% and 14.9% respectively since end-May.
The MSCI frontier markets index currently trades on a 1.85 multiple of book value versus 1.53 for the emerging markets index. The 20.6% premium is close to the previous high (before this year) of 24.4% reached in January 2008. Frontier markets were on a significant discount to emerging markets between 2009 and 2012.
Monetary trends in the larger frontier countries do not suggest relative economic or market strength. The six-month change in real narrow money is modest or negative in six of the eight largest MSCI markets** – see chart.
Frontier markets are tiny – the market cap of the MSCI index is 2.7% of its emerging markets counterpart – so prices could be forced still higher if investors increase allocations in response to recent strong performance. The mammoth Norwegian sovereign wealth fund is, reportedly, raising exposure – or, more likely, has already done so.
*As of Friday’s close.
**The top eight markets account for 79% of the index.

UK Bank rate hike needed to offset bank-led monetary easing
The MPC is debating when to raise interest rates. No member, presumably, thinks that policy should be loosened. A backdoor easing, however, is taking place as banks continue to cut lending and deposit rates. An immediate rise in Bank rate is needed simply to offset this additional monetary stimulus.
The chart shows estimates of the average interest rates banks receive / pay on the outstanding stocks of household lending and deposits. The average lending rate has fallen by 0.24% since end-2012 while the deposit rate has been cut by 0.58%*. The lending / deposit rate spread, nevertheless, remains low by historical standards.
These averages are likely to fall further, since the interest rates on new business are below those on the outstanding stocks. New fixed-rate bonds, for example, now yield just 1.34% versus 2.38% on the yet-to-mature stock. Similarly, the interest rate on new fixed-rate mortgages is 3.23% versus 3.67% on outstanding loans**.
Monetary conditions at end-2012 were sufficiently loose to generate strong nominal and real GDP growth. The fall in lending / deposit rates since then represents an unwarranted further relaxation, requiring an MPC response. With the supply of funding expanding***, a half-point Bank rate hike might be needed to return average deposit / lending rates to end-2012 levels.
MPC officials have argued that it was necessary to maintain official rates at an emergency level because of an unusually large wedge between bank interest rates and Bank rate. With this wedge narrowing, a compensating adjustment in Bank rate is overdue.
*As of May. Averages estimated from Bank of England interest rate and volume data for different types of business.
**Bankstats table G1.4.
***Banks expect an increased supply of household deposits in the third quarter, partly due to the introduction of NISAs, according to the latest Bank of England bank liabilities survey.


