
Entries from July 1, 2014 - July 31, 2014
Time and cycles
 NS Partners
 Post a Comment
Time-based economic forecasting is unfashionable. Until the mid-twentieth century, economists were sympathetic to the idea that business activity and prices fluctuate in regular cycles. The majority view today is that booms / busts reflect policy errors, market failures or supply-side shocks; cycles still occur but they are unpredictable. The behaviour of the global economy in recent years, however, is explicable in terms of the old fixed-length cycles. The approach suggests that another significant economic downswing will occur in 2016.
According to the old approach, there is no single “business cycle”. Observed growth fluctuations, instead, are the product of separate cycles in different parts of the economy. The three main cycles are: the 3-5 year Kitchin cycle in stockbuilding; the 7-11 year Juglar cycle in business investment; and the 15-25 year Kuznets building cycle. Each cycle is named after the economist who “discovered” it.
Recessions almost always involve significant weakness in business investment. In the US, recessions occurred in 1981-82, 1990-91, 2001 and 2008-09, according to the National Bureau of Economic Research. The spacing, clearly, fits the 7-11 year periodicity of the Juglar cycle.
The severity of recessions, however, depends on the direction of the other cycles. In 2008-09, a Juglar downswing coincided with the weak phase of the Kitchin stocks cycle and the final stages of a downswing in the longer-term Kuznets building cycle. The previous occurrence of simultaneous weakness in the three cycles was in 1974-75. Global industrial output fell by 13% from peak to trough in 2008-09 and by 12% in 1974-75 – much larger declines than in other post-World War Two recessions.
In the early 2000s, by contrast, the recessionary impulse from the Juglar investment cycle was moderated by an upswing in the Kuznets building cycle. The 2001 US recession was unusually mild, while the UK avoided any fall in output. Central bankers attributed this benign result to their policy-making brilliance, a belief that contributed to complacency during the credit bubble and the initial stages of the subsequent bust.
The short-term Kitchin stocks cycle is usually associated with minor growth fluctuations, unless reinforced by the other cycles. Such fluctuations, however, can still have a significant impact on financial markets. The last Kitchin cycle downswing occurred in 2011-12: the global economy hit a soft patch and equities fell by 23%. The weak cyclical backdrop contributed to the Eurozone crisis.
What do the cycles suggest about current economic prospects? The last Juglar cycle downswing began in 2008 so the next one is scheduled to occur between 2015 and 2019. The Kitchin cycle is due to enter another weak phase in 2015-16. A recession will be likely if the two downswings coincide. The most probable year for a recession is 2016, since the Kitchin cycle will embark on another upswing in 2017-18, offsetting Juglar cycle weakness.
Thankfully, any such recession should be of average severity or even mild because the longer-term Kuznets building cycle will remain in an upswing until the early 2020s, at least. The “great recession” of 2008-09 was a once-in-a-generation event resulting from a rare confluence of the three cycles. The next boom / bust episode will be painful but not system-threatening.
UK growth should stay strong in H2
“Forecasters’ droop” is the tendency of economists to predict that a stronger-than-expected data series will fall back to “trend”, despite a lack of catalysts for such a development. The MPC appears to have contracted the disease, judging from the expectation reported in the July minutes of “GDP growing by 0.9% in Q2, before slowing modestly into the third and fourth quarters”.
Rather than slow, growth is likely to remain robust and may even rise further in the second half, for three reasons. First, the global economy is picking up at mid-year, as foreshadowed in posts extending back to February. Today’s stronger “flash” PMI readings for July for China and the Eurozone are further confirmation of a revival. This is boosting exports, despite a firm pound: expected foreign orders were at a 19-year high in the July CBI industrial trends survey released earlier this week – see chart*.
Secondly, real narrow money expansion – the only indicator to give early warning of economic strength in 2013-14 – remained stable and strong in May, the latest available month. Broad money growth has also been steady while bank credit has started to rise. Monetary trends lead the economy by about six months; no slowdown is signalled before end-2014 at the earliest.
Thirdly, monetary conditions have eased further during the first half, reflecting a continued decline in average interest rates on bank lending and deposits – see Monday’s post. This could lead to additional strength in monetary data, in turn signalling faster, not slower, economic growth. June money numbers are reported on 29 July.
*Seasonally adjusted data.

Will the UK become a high-tax economy?
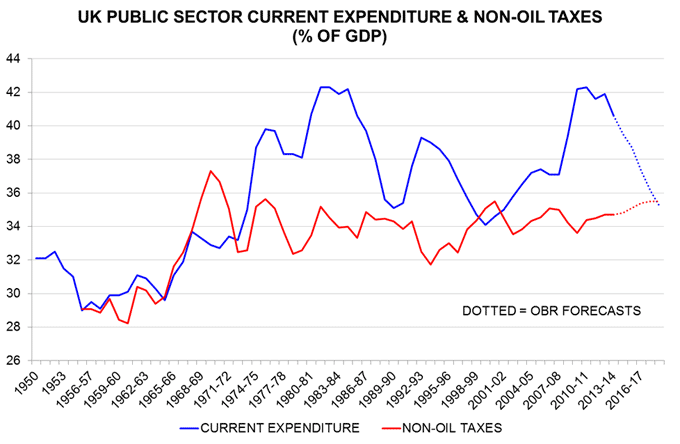
UK whole-economy output has surpassed its level in the 2007-08 financial year yet the budget deficit remains huge – a projected 5.5% of GDP on an underlying basis* in 2014-15, according to the Office for Budget Responsibility (OBR), compared with 2.6% in 2007-08. Why hasn’t economic recovery delivered commensurate fiscal improvement?
The main reason is that public current expenditure skyrocketed after 2007-08 and – despite “austerity” – has yet to return to earth. Current spending as proportion of GDP rose from 37.1% in 2007-08 to a peak of 42.3% in 2010-11. It was still 40.6% in 2013-14 and is projected to take another three years to reach the 2007-08 level – see chart. (The 2007-08 spending share was not historically low.)
The still-wide fiscal deficit cannot be attributed to a dearth of tax receipts. The share of non-oil taxes in GDP in 2013-14, at 34.7%, was above the average of 34.4% during Labour’s rule from 1997 to 2010. It is projected to rise to 35.5% by 2017-18 – a level matched or exceeded in only five years in British fiscal history.
Current fiscal plans involve a 1980s-scale cut in the spending share of GDP. The earlier reduction was delivered by Conservative governments with sizeable parliamentary majorities amidst a prolonged economic boom driven partly by strong credit expansion. A repeat performance, in other words, is unlikely. Instead, the next administration may try to close the fiscal gap by moving the tax share up to a continental European level – despite negative consequences for supply-side economic performance.
*Public sector net borrowing excluding temporary effect of financial interventions, APF and Royal Mail transfers.
Equities versus cash investment rules: an update
Previous posts have described two simple investment rules for switching between global equities and US dollar cash. The rules still favoured equities at the time of the last update in October 2013. The MSCI World index has since returned 11% in US dollar terms. As detailed below, one of the rules remains positive on equities while the other has turned neutral.
The first rule holds equities or cash depending on whether G7 annual real narrow money supply expansion is higher or lower than industrial output growth. A faster rise in money holdings than output suggests that investors are about to deploy cash in asset markets, pushing up prices. Conversely, a slowdown of money relative to output may signal a deteriorating liquidity backdrop for equities. An investor following this rule over the last 30 plus years would have captured much of the rise in equities while largely avoiding bear markets. The rule outperformed a strategy of buy and hold by 3.5% per annum (pa) between 1969 and 2013 – see first chart*.
The second rule switches between equities and cash depending on whether the G7 longer leading indicator followed here is above or below its long-run average. The indicator is designed to predict turning points in industrial output growth: a rise through the average signals economic acceleration; a fall below it warns of a slowdown. The backtest performance of the rule is slightly superior to that of the excess money rule; it captures more of the rise in equities and avoids a larger proportion of the bear phases. The rule outperformed buy and hold by 5.9% pa over 1969-2013 – first chart.
These returns are hypothetical because they are based on currently-available data. The excess money results, however, may be realistic, since annual real money and industrial output growth could have been calculated in real time and subsequent data revisions would probably have made little difference to the timing of cross-over signals. By contrast, the leading indicator series incorporates changes over the years in the construction and constituents of the OECD’s country leading indices. Data revisions to these indices, moreover, are sometimes significant. The historical return of the leading indicator rule, therefore, is unlikely to have been achievable in practice.
G7 annual real narrow money expansion is still above industrial output growth – second chart. The G7 longer leading indicator, however, has fallen recently and is close to the long-run average – third chart**. So the first rule continues to favour equities while the second is neutral.
The rules, it should be noted, are intended to capture the bulk of gains during market upswings while limiting losses during downswings – they rarely signal the exact top of a bull run or bottom of a bear market.
*A six-month lag is applied before buying equities after a positive cross-over.
**The indicator has been affected by recent Japanese data volatility due to the April sales tax rise.


Why the "new normal" for UK Bank rate may be 4% not 2.5%
Bank of England Governor Mark Carney has suggested that a “normal” level of Bank rate is now about 2.5% versus 5% before the financial crisis. This suggestion is defensible based on the recent spread between bank interest rates and Bank rate – this has been much higher than before the crisis, requiring Bank rate to be lower to compensate. The spread, however, is now on a falling trend. This suggests that 1) a rise in Bank rate is overdue and 2) the “new normal” for Bank rate may be 3.5-4% rather than 2.5%.
Changes in bank deposit and lending rates are a key part of the transmission mechanism from MPC decisions about Bank rate to the economy. In the 10 years up to Lehman’s bankruptcy in September 2008, the interest rate on the stock of bank lending to households was 2.0 percentage points (pp) above Bank rate on average, while the rate on household deposits was 1.3 pp below it*. The deposit rate moved above Bank rate during the crisis and has remained significantly higher since, while the lending rate / Bank rate spread roughly doubled from its earlier level – see first chart.
These changes can be summarized by comparing an average of the household lending and deposit rates with Bank rate. The spread between this combined household interest rate and Bank rate was 0.3 pp on average in the 10 years up to Lehman’s bankruptcy but has been 2.4 pp since – second chart.
The rise in bank interest rates relative to Bank rate implies that a given level of official rates now is equivalent, in terms of economic impact, to a much higher setting before the crisis. A simple way of comparing the two periods is to subtract the pre-crisis average spread from the combined household interest rate in each month since September 2008. The resulting series can be considered to be an “effective” level of Bank rate based on pre-crisis conditions – third chart.
This effective rate fell by much less than actual Bank rate after the crisis, averaging 2.7% since September 2008. It has, however, declined from 2.7% to 2.2% since late 2012. This reduction reflects Bank of England / ECB measures to lower funding costs, as well as banks’ efforts to strengthen their finances, which have resulted in a lower credit risk premium on their borrowing.
The current effective rate of 2.2% is 2.8 pp below Mr Carney’s 5% estimate of the “normal” level of Bank rate before the crisis. Put differently, assuming no further change in the spread between bank interest rates and Bank rate, the latter would need to rise by 2.8 pp to achieve the same economic impact as a 5% level before the crisis. On this assumption, the “new normal” for Bank rate is 3.3%** (i.e. the actual 0.5% rate plus 2.8 pp).
The decline in the spread between bank interest rates and Bank rate, however, may extend. Rates on new time deposits and fixed-rate mortgage lending are currently 0.3 pp and 0.4 pp respectively below those on the outstanding stocks, suggesting a decline in the outstanding rates as existing business matures and is replaced. Wholesale funding costs, meanwhile, may ease further as banks add to their capital buffers; the ECB’s forthcoming TLTRO operations may have an additional helpful impact. Assuming, conservatively, a 0.5 pp reduction in the spread, the effective level of Bank rate, based on a 0.5% actual rate, will move down to 1.7%. This, in turn, would imply that actual Bank rate would need to rise to 3.8% to be consistent with the “old normal” of 5%.
The decline in bank lending and deposit rates since late 2012 suggests that the MPC should already have started to raise Bank rate. The level of bank interest rates in late 2012 was sufficiently stimulatory to generate strong growth and a rapid erosion of economic slack in 2013. The 0.5 pp fall since then represents an unwarranted additional loosening of monetary conditions. Bank rate, in other words, needs to be raised by 0.5 pp immediately simply to return its effective level back to late 2012; a larger increase would be required to effect a tightening of policy.
*January 1999 to September 2008 inclusive. Lending / deposit rates on outstanding stocks estimated from Bank of England rate / volume data for different types of business.
**Mr Carney’s estimate of a “new normal” of 2.5% may be based on the average post-crisis bank interest rate / Bank rate spread rather than the current level; it may also incorporate a judgement that the economy faces additional medium-term headwinds, e.g. from fiscal tightening, an overhang of household debt and Eurozone weakness – see the report of his BBC interview on 27 June.
Why Eurozone economic news should improve
The Citi Eurozone economic surprise index has been negative since the spring but the balance of news may now improve, based on an expected revival in global activity and respectable narrow money trends. Growth, however, will probably lag other regions.
The industrial sector has lost momentum since early 2014. The new orders component of the manufacturing purchasing managers’ survey declined steadily between January and June, though remains in expansion territory. Industrial output fell by 1.1% in May to stand 1.0% lower than six months earlier*.
The slowdown mainly reflects global trends. Six-month growth of global industrial output has fallen since November 2013, reaching an 11-month low in May. In addition, the euro trade-weighted exchange rate has been stable at a strong level, while real money expansion has been lower in the Eurozone than in the US / UK, suggesting less of a cushion from expanding domestic demand.
Global real money trends and leading indicators, however, are signalling a near-term pick-up in activity – see previous post. US and Chinese purchasing managers’ new orders indices have strengthened and typically lead the Eurozone measure – see first chart. Equity analysts’ earnings forecast revisions, which correlate with the new orders measure, have recovered – second chart.
Eurozone real narrow money expansion, which signalled the 2011-12 recession and subsequent recovery, has fallen but remains at a level historically consistent with moderate economic growth – third chart. The latest reading, for May, predates the ECB’s recent easing package. The last ECB quarterly bank lending survey, conducted in April, reported that SME credit conditions were expected to loosen further, also suggesting respectable output prospects – fourth chart**. (The next survey is scheduled for release on 30 July.)
Are current banking problems in Portugal symptomatic of monetary / economic deterioration across the periphery? Country narrow money data actually show relative strength in Portugal recently but weakness in Ireland and Greece – fifth chart. Real money is growing moderately in Italy and Spain, suggesting limited downside economic risk.
*May weakness was probably exaggerated by holiday effects, which should unwind in June.


