Entries from July 1, 2012 - July 31, 2012
UK house prices: still moving sideways
Previous posts argued that UK house prices were supported by the high level and growth of rents and would probably continue to defy bearish predictions. The “best” value- and volume-weighted measures are the LSL Acadametrics and Land Registry indices, because of their larger sample size and inclusion of cash transactions*. These rose by 3.0% and 0.4% in the 12 months to June and May respectively.
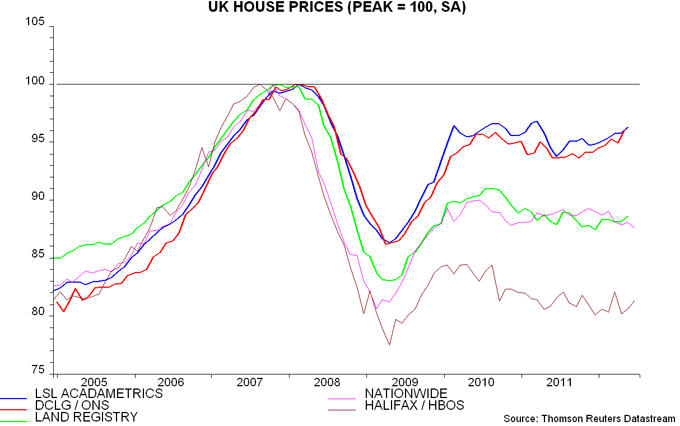
The first chart updates a comparison of five house prices indices, rebased to their respective 2007-08 peaks and seasonally adjusted. The LSL Acadametrics index was only 3.3% below peak in June. Its resilience is confirmed by the Office for National Statistics (previously Department of Communities and Local Government) index, which is also value-weighted and was 3.9% lower in April.
These indices, of course, give greater weight to top-end strength. The volume-weighted Land Registry index, by contrast, was 11.4% below peak in May, though – as noted – has moved sideways over the past year. Its message is confirmed by the Nationwide index, with a shortfall of 12.4% in June, but not the HBOS index, which is down by 18.6%. The HBOS measure has displayed a downward bias relative to the other two volume-weighted indices in recent years, suggesting caution in its use (and explaining its popularity among housing market bears).
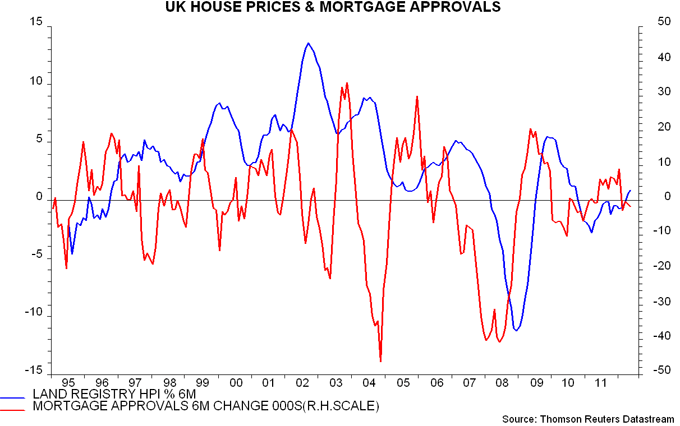
Within a larger picture of stability, house prices may soften modestly during the second half of 2012, based on a recent fall in mortgage approvals – second chart.
*A value-weighted index (i.e. giving greater weight to more expensive houses) should be used if the focus of interest is the aggregate value of the existing housing stock. A volume-weighted measure (i.e. giving equal weight to expensive and inexpensive houses) is appropriate if the focus is the price of a “typical” house.


UK "FLS" success may require relaxation of capital rules
The Bank of England’s new funding for lending scheme (FLS) is unexpectedly generous and will benefit banks and existing borrowers. Its impact on new lending, however, may disappoint unless the Bank simultaneously revokes its recent guidance to banks to raise their capital ratios further.
The effect of the scheme is to allow banks to refinance up to 5% of existing lending at a minimum interest rate approximately equal to the Treasury bill rate plus 25 basis points (bp), i.e. below 0.75% currently. They can borrow for up to four years and the minimum rate will apply as long as banks do not contract their loan books between now and the end of 2013. This represents cheap term funding – for comparison, banks paid an average 3.2% on new household time deposits in May. The scheme is structured similarly to the existing discount window facility (DWF) but with a longer term (i.e. up to four years versus one month) and much lower fee (the DWF charges 200 bp for lending against pools of loans).
Suppose that banks refinance the maximum 5% – £80 billion in aggregate – at the minimum rate, replacing funding currently costing 2 percentage points more (i.e. about 2.75%). This would represent a saving of £1.6 billion per annum, equivalent to 0.1% of GDP – small but not insignificant. Banks, of course, will be under strong pressure to pass on the saving to borrowers.
The minimum rate also applies to new lending. Banks, for example, could borrow at 0.75% to fund new mortgage loans, the interest rate on which averaged 3.75% in May. Suppose aggregate lending grew by 5% or £80 billion. A 3 percentage point spread on the new loans would imply an additional “gain” of £2.4 billion per annum (i.e. on top of the £1.6 billion from refinancing existing lending).
While banks are likely to take advantage of the opportunity to refinance cheaply, however, regulatory pressure to boost capital ratios coupled with a high current cost of capital may deter the desired expansion of lending, despite attractive spreads. The scheme’s implicit assumption, in other words, that funding – rather than capital – is the key constraint on credit supply may be flawed. The Bank’s Financial Policy Committee, of course, recently added to banks’ incentive to conserve capital by recommending that they increase buffers “in order to help to protect against the currently heightened risk of losses”.
Chinese indicators mixed, suggesting continued below-trend growth
The Chinese economy could disappoint both “hard landers” and reaccelerationists during the second half, with leading indicators and monetary trends suggesting stable, slow growth.
Six-month industrial output expansion was an estimated* 4.0% (not annualised) in June, little changed from April and May and below a 6.9% average since 2005. This performance is consistent with recent moderately soft PMI results – see first chart.
A forecasting indicator based on the OECD’s Chinese leading index provides a slightly longer lead than the PMI – second chart. This, too, has been moving sideways recently. (Caveat: the index, while useful, is sometimes subject to large revisions.)
Monetary indicators paint a mixed picture. A slowdown in real money and loan growth predicted the loss of economic momentum from early 2011. Six-month expansion of real M2 and loans bottomed in mid 2011, picked up into early 2012 but fell back into mid-year – third chart. This decline argues against a near-term industrial reacceleration although real M2 / loan growth levels are respectable.
“Hard landers”, however, can cite continued real M1 contraction – narrow money has diverged to an unusual extent from M2 and loans since mid 2011. M1 lagged the other measures at the 2008 trough and 2009 peak, suggesting that it will revive to close the gap over coming months. Caution is warranted until such a pick-up is confirmed.
*A monthly unadjusted volume index was estimated from published data on growth rates and output value / prices. This was then adjusted for Chinese New Year timing effects and other seasonal factors.


UK liquidity policy relaxation unlikely to boost lending, may offset QE
The Financial Policy Committee (FPC) has recommended that the Financial Services Authority (FSA) consider lowering its microprudential liquidity guidance for banks while encouraging institutions to reduce “buffers” held above these guidance levels. The hope is that a release of liquidity “would be enough to make a big impact on real economy lending in the UK”, to quote the FPC’s Andrew Haldane.
There is little evidence, however, that bank lending is currently liquidity- as opposed to capital-constrained. The FPC has simultaneously recommended that banks further increase their capital buffers “to protect against the currently heightened risk of losses”. The Committee’s preference, of course, is that banks raise capital levels rather than boost ratios by cutting core assets but it is unclear how this is supposed to be achieved given weak profitability and lack of demand for bank equity and other capital instruments; the balance, in any case, is for individual institutions to decide, not the FSA. The net impact on lending of the contradictory liquidity and capital guidance, therefore, may be negative.
Banks, nonetheless, may take advantage of the revised liquidity policy, reducing holdings of low-yielding liquid assets in order to repay more expensive funding rather than increase loans. Banks are unable to lower the aggregate stock of reserves at the Bank of England, which is determined by QE; an individual institution can cut its own reserves by repaying borrowing but these will be transferred to another bank. A reduction in aggregate liquidity, therefore, would require sales of gilts and other high-quality marketable instruments.
Bank sales of gilts to the non-bank private sector have a negative impact on the broad money supply, since the buyers of the gilts pay for them by running down their bank deposits. Such sales, therefore, would offset the intended monetary stimulus from the recent further expansion of QE. The FPC’s liquidity initiative, in other words, as well as failing to stimulate lending, may serve to frustrate the efforts of its sister MPC.

Greece makes surprising fiscal progress but is lower spending sustainable?
First-half Greek budget data are consistent with achievement of the target of reducing the state primary deficit to 0.5% of GDP in 2012. Recent improvement, however, reflects a large cut in expenditure that may yet prove unsustainable.
The primary deficit totalled €3.71 billion in the year to June, down from €10.53 billion in the prior 12 months, implying a fall from 4.8% to 1.8% of GDP – see chart. The rate of decline, if sustained, is consistent with meeting the target in the 2012 Supplementary Budget of a deficit of €1.09 billion or 0.5% of GDP in calendar 2012. (Greece’s IMF programme targets a primary deficit of 1.0% of GDP in 2012 but this is on a wider general government basis including local governments, social security funds etc.)
The overall state deficit has declined by less, totalling €22.21 billion or 10.6% of GDP in the year to June after €25.03 billion or 11.3% in the prior 12 months. Interest payments rose significantly over July 2011-March 2012 but are now falling year-on-year as a result of the PSI debt restructuring. The Supplementary Budget projects an interest bill of €13.05 billion in 2012, down from €16.35 billion last year, in which case the overall deficit will decline to €14.14 billion or 6.9% of GDP, assuming that the primary shortfall target of 0.5% is met.
The fall in the primary deficit is the result of a substantial cut in expenditure that has offset weaker tax receipts – non-interest spending and revenue fell by 18.8% and 10.5% respectively in the 12 months to June from the prior year. The risk is that the spending decline partly reflects a backloading of payments that will appear in the second half of the year rather than a sustainable reduction. The suggestion, nevertheless, is that the last two Greek administrations achieved greater fiscal progress than widely expected, even if structural reform efforts have fallen short.

UK online vacancies suggest employment set-back
A puzzle in recent UK economic data is that employment has risen despite a purported fall in GDP. The Labour Force Survey (LFS) measure of employees in employment rose by 146,000 or 0.6% between October and April (three-month moving average), while non-oil GDP is currently estimated to have fallen by 0.3% and 0.2% in the fourth and first quarters respectively.
The apparent contradiction could just reflect noise in the employment data. The recent rise in employees follows an equally-puzzling slump last summer, when the economy was supposedly growing moderately. The April employees number was 0.5% lower than a year before – more consistent with a reported rise of only 0.3% in non-oil GDP in the year to the first quarter, though still a smaller decline than would have been expected.
The puzzle, in any event, may be partially resolved by renewed softness in employment data this summer, judging from the Monster index of online job vacancies. Seasonally adjusted, the index rose in tandem with the LFS employees measure from late 2011 but has fallen sharply since April – see chart. The suggestion of weakness is confirmed by other recent evidence, including a plunge in the permanent placements index in the Markit report on jobs to its lowest level since 2009.
Labour market deterioration may deepen gloom about the economy even as prospects for late 2012 are improving, based on a revival in real money expansion across a variety of narrow and broad measures – see previous post.

