
Entries from January 1, 2012 - January 31, 2012
Bank funding spreads reflecting ECB / BoE divergence
 Simon Ward
 Post a Comment
The three-month euro LIBOR / overnight indexed swap spread fell by a further 5 basis points today, confirming that the ECB’s subsidised term lending has succeeded in easing bank funding pressures. The corresponding sterling spread, by contrast, has remained stable, reflecting the Bank of England’s refusal to offer similar support to UK banks.

The premium of the euro over the sterling spread has narrowed from a peak of 45 basis points to 21 today. UK bank stocks outperformed their Eurozone equivalents as this premium widened in late 2011 – the recent closure could signal a reversal of this relative gain.

UK online vacancies holding up
It is anyone’s guess what GDP number official statisticians will manufacture next week but resilient online job demand suggests that the economy flatlined rather than contracted in the fourth quarter.
The chart shows a monthly GDP estimate derived from output data covering services, industry and construction together with a seasonally-adjusted version of the Monster employment index – a tally of online vacancies posted on career websites and job boards (not just Monster’s). Both GDP and the index dipped in October but the latter rallied in November / December, resulting in minimal change for the quarter. This contrasts with a plunge in spring 2008 as the economy entered a recession.
China hard landing risk recedes as real money picks up
The previous post expressed the hope that a pick-up in emerging E7 real money supply growth would help to compensate for a likely US slowdown, thereby sustaining an expansionary global monetary backdrop. Chinese monetary data for December offer support for this scenario.
Posts here last year drew attention a sharp slowdown in Chinese real money and loan growth, suggesting an increasing risk of a “hard landing”. Policy-makers, however, appear to have averted the danger by easing off on the brakes last autumn, with a consequent revival in nominal monetary trends magnified in real terms by falling inflation.
Six-month real M2 growth in December was the highest since March 2010 (based on seasonally adjusted numbers calculated within Datastream). Real M1 expansion – emphasised by the forecasting approach employed here – has risen by less but, in China’s case, seems to lag real M2, suggesting further improvement in early 2012.

OECD leading indices confirm global lift, real money hints at spring growth peak
The OECD’s leading indices continued to recover at the margin in November, confirming an earlier signal of global economic improvement from real money supply trends.
The chart shows six-month growth rates of G7 plus emerging E7 industrial output and real narrow money together with a composite leading indicator derived from the OECD indices. Real money typically moves about six months ahead of output while the indicator leads by about three months.
The indicator was very weak last summer but moved back into positive territory in October and rose further in November, reaching its highest level since February. This suggests that the late 2011 recovery in global industrial momentum will be sustained in early 2012.
Six-month real money expansion, however, appears to have peaked in October, consistent with output growth topping out in the spring. Such a scenario would be confirmed by a peak in the OECD-based indicator in early 2012, probably January.
The view here of economic prospects for later in 2012 will be conditioned by the extent of any further real money slowdown. The hope is that a likely weakening of US monetary trends will be counterbalanced by a pick-up in the E7 and Euroland in response to recent and prospective policy easing.

Are Eurozone banks "hoarding" liquidity?
Media reports continue to refer to the level of balances in the ECB’s deposit facility as a gauge of liquidity “hoarding” by banks. If only it were so simple.
An increase in the ECB’s lending to banks in repo operations automatically injects liquidity into the system. Banks hold this cash either in their current accounts at the ECB or the deposit facility. Since they earn no interest on current account balances in excess of reserve requirements, it mostly ends up in the deposit facility.
Suppose that banks with more cash increase lending or buy existing securities (i.e. they don't "hoard"). The cash is transferred to other banks (those where the recipients of the lent funds or the sellers of the securities hold their accounts), whose current account / deposit facility balances therefore rise. The aggregate position falls only if the cash flows to weaker banks, who repay lending from the ECB, thereby withdrawing liquidity from the system. Otherwise, use of the deposit facility will remain high even though banks are not “hoarding”. (Liquidity can also be withdrawn by banks buying new government securities, resulting in cash being transferred from banks’ to governments’ accounts with the ECB.)
The daily deposit facility numbers, therefore, provide little information about banking system activity and risk aversion – the latter is better captured by the three-month Euribor / overnight interest rate swap spread, which yesterday fell to its lowest level since late November.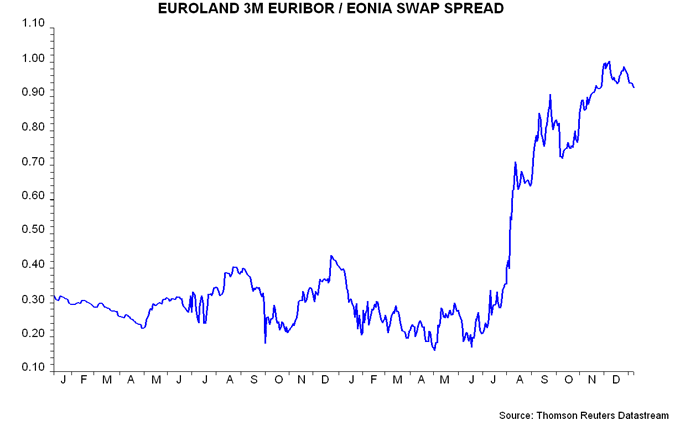
UK non-banks dump gilts as official / foreign buying soars
Bank of England figures on gilt purchases cast doubt on Chancellor George Osborne’s claim that record low yields represent a vote of confidence in the UK’s economic and fiscal fundamentals. Yields, instead, have been driven down by a combination of QE, regulatory-inspired bank buying and capital flight from the Eurozone (i.e. a loss of confidence in competing markets).
In November alone, the Bank bought £23.9 billion in QE operations while overseas investors ploughed £16.3 billion into gilts – just below a record £16.6 billion in September 2008, when Lehman failed. With the Debt Management Office (DMO) issuing “only” a net £11.9 billion, official and foreign demand was sated by UK non-bank investors and banks selling on a large scale – reflecting, presumably, a judgement that yields were artificially and unsustainably low. UK non-banks reduced their holdings by a record £23.1 billion in November following a £16.7 billion disposal in October.
The dominant role of policy-related and foreign buying is not new but is reflected in figures covering 2009-11 (i.e. up to November, a period of 35 months) – see chart. The DMO has issued a net £475.1 billion of gilts since the start of 2009 – equivalent to a third of annual GDP. The Bank has hoovered up £240.9 billion of this flow leaving £234.2 billion – less than half – to be absorbed by “the market”*. Capital flight from the Eurozone contributed to foreigners buying £153.8 billion with the remainder absorbed by UK banks, largely reflecting regulatory pressure to increase holdings of “high-quality” liquid assets. Despite the supply avalanche, therefore, UK non-bank investors – the traditional buyers of gilts – have actually reduced their holdings, by £6.1 billion, since the start of 2009. They bought £37.2 billion in the prior three years (i.e. 2006-08).
With conventional market drivers suppressed by price-insensitive official and foreign demand, the key determinants of whether / when yields will recover will be QE and regulatory policies and the success or failure of Eurozone stabilisation efforts. UK economic and fiscal trends, as well as rating agency decisions, are probably of second-order importance.

