Entries from December 1, 2013 - December 31, 2013
Chinese monetary trends still soft
Monetary trends and survey evidence continue to suggest that the Chinese economy will slow into early 2014.
Activity strengthened over the summer, with six-month growth in industrial output* reaching a 15-month high in September. This followed respectable real money expansion in early 2013 – see first chart. Improving prospects were confirmed by a rise in the official purchasing managers’ new orders index** from the spring.
Real broad and narrow money growth, however, slowed sharply after April, the latter falling well beneath its historical average. October figures today were soft again. This warning signal has received tentative support from a fall in the new orders index since August, although the current reading remains respectable. Six-month output expansion ticked down in October, possibly marking the start of a downshift.
The tightening of monetary conditions is a side-effect of official efforts to clamp down on excessive non-bank credit creation. The one-month repo rate, a gauge of money market liquidity, was below the levels of the last two years in early 2013 but is now significantly higher – second chart. Ongoing policy restriction suggests that monetary trends will remain subdued.
*Level series estimated from official data and seasonally adjusted.
**Seasonal adjustment applied to published data.


Broad monetarism still dominant but narrow money signals more reliable
Most monetary economists, and British monetarists in particular, focus on trends in broad money and credit when forming an assessment of monetary conditions. The approach here considers narrow money developments, additionally, to contain important information, particularly for forecasting purposes.
The dominance of broad monetarism partly reflects the influence of Friedman and Schwarz, who emphasised a broad measure in their seminal A Monetary History of the United States, 1867-1960. In the UK, leading monetarists, including Professors David Laidler and Tim Congdon, have framed theories of monetary equilibrium in terms of broad money.
A further reason for the neglect of narrow money is a widespread tendency to confuse the concept with the monetary base, i.e. currency in circulation and bank reserves held at the central bank. QE policies, clearly, have disrupted any relationship that existed between the monetary base and the economy.
Narrow money, by contrast, refers to forms of money that can be used by non-banks to make final payment when purchasing goods, services or assets. A narrow money aggregate should, at a minimum, include currency held outside the banking system and checkable deposits; not all instant-access deposits, however, can be used in immediate, final settlement. In practice, data availability constrains the construction of an “ideal” aggregate; the nationally-defined M1 measure is used for most countries followed here. Narrow money, to repeat, does not include bank reserves so is not automatically boosted by QE.
Broad monetarists continue to dominate the airwaves, enjoying support from prominent media commentators, but their forecasting performance has been distinctly patchy in recent years. Narrow money signals, by contrast, have been generally reliable.
-
Global real narrow money contracted ahead of the 2008-09 recession; broad money growth slowed but remained solid by historical standards – see chart.
-
The broad monetarists forecast “double dips” in 2010 and 2011 as real broad money growth fell below the low reached in the 2008-09 recession; narrow money, by contrast, signalled that economic expansion would slow but remain respectable.
-
Real narrow money growth fell sharply around end-2011, warning of economic weakness in mid-2012; broad money expansion was solid and stable over this period.
The narrow monetarists have scored additional major wins at the country level. In particular, narrow money gave a much stronger signal that the Eurozone crisis would abate from late 2012, and that UK economic growth would far exceed official and consensus expectations in 2013.
Global real narrow and broad money are currently giving a consistent message: growth has moderated since spring 2013, suggesting that economic expansion is close to a peak but will remain respectable in early 2014.
There are, however, divergences at the country level. Broad monetarists, for example, are warning of a “triple dip” in the Eurozone because real M3 has recently stagnated, but M1 continues to expand solidly, suggesting that a slowburn economic recovery will proceed. There is an opposite signal in China, with narrow money giving a more downbeat message for economic prospects.
The dominant influence of the broad monetarists combined with their evident inability to produce reliable forecasts may explain why economists generally continue to devote little attention to monetary analysis. This may allow narrow monetarists to retain a forecasting advantage but policy-makers are likely to make further mistakes while they neglect important monetary signals.
Global leading indicators confirm coming growth peak
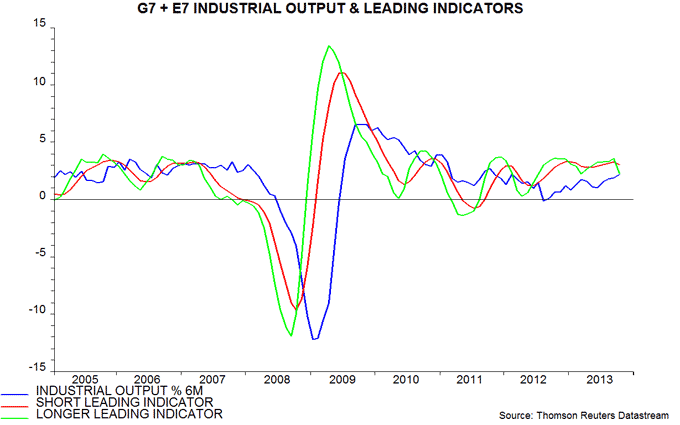
The approach to forecasting the global cycle employed here relies partly on short and longer-term leading indicators calculated by transforming and combining the OECD’s country leading indices. The message from these derived indicators often disagrees with the OECD’s interpretation of its own data.
For example, today’s OECD press release accompanying the release of October figures states that its indicators “point to an improving economic outlook in most major economies”. The derived short and longer-term indicators, however, fell from September highs, suggesting that current strong global growth is approaching a peak – see first chart.
The short and longer-term indicators have led turning points in six-month industrial output momentum by averages of three and five months respectively in recent cycles. The September peak in the two indicators, therefore, is consistent with global industrial output expansion topping out between December and February.
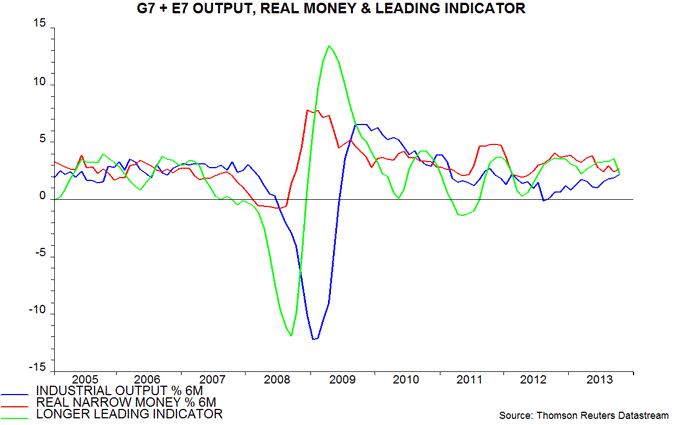
The signal from the indicators is consistent with monetary trends: global six-month real narrow money expansion peaked in May and typically leads output growth by six months or so – second chart. The latest monetary data, for October, remain respectable, suggesting that economic momentum will moderate rather than slow sharply in early 2014.


US unemployment at original QE terminal value
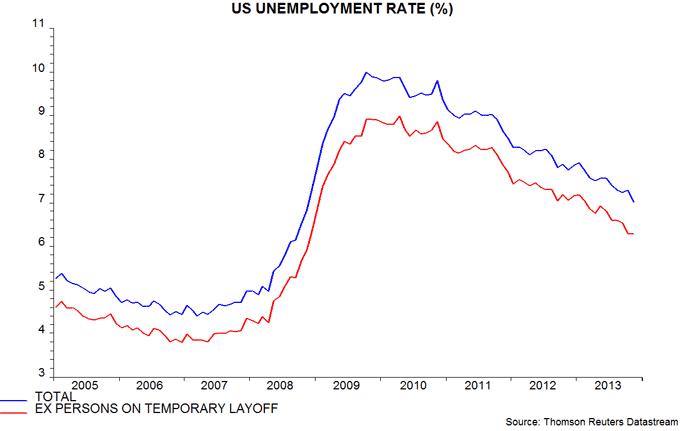
A post a month ago argued that the US unemployment rate would have fallen to 7.0% in October, rather than risen to 7.3%, but for the government shutdown, which caused a surge in temporary layoffs. The rate duly reached this level (7.02% unrounded) in November as the shutdown distortion unwound – see chart.
In his June press conference, Fed Chairman Bernanke stated that continued labour market improvement supported by a pick-up in economic growth would cause the FOMC to moderate the pace of securities purchases later in 2013. “In this scenario, when asset purchases ultimately come to an end, the unemployment rate would likely be in the vicinity of 7%.”
Mr Bernanke has boxed himself in. He, and his successor, are reluctant to signal the end of QE, partly out of concern that this would cause markets to advance expectations of policy tightening. However, failing even to begin moderating purchases when unemployment is already at the stated terminal value risks undermining the credibility of the Fed’s interest rate guidance.
As previously discussed, one solution would be to announce a reduction in QE purchases this month but simultaneously cut the interest rate on bank reserves from 0.25% to, say, 0.10%. This would underline that QE decisions have no implications for interest rate policy, while raising the possibility that an increase in the velocity of circulation of reserves will offset a slower rate of liquidity injection.
UK required public spending cut still huge
The Office for Budget Responsibility’s forecast that the public sector deficit will be eliminated in 2018-19 depends on the share of current public spending in GDP dropping by a whopping 5.2 percentage points over the next five years. The spending share has retreated from a post-war record 42.4% in 2009-10 and 2010-11 but remains historically high, at a projected 40.8% this year – see chart.
A reduction on the required scale occurred in the late 1980s but was achieved with the aid of strong economic growth – GDP rose by an annual average 4.3% in the five years to 1989 in real terms and by 9.9% in nominal terms. The OBR projects growth of only 2.5% and 4.3% respectively over the next five years.
Sceptics argue that a spending overshoot will necessitate further tax increases after the 2015 election. Excluding oil revenues, however, the tax share of GDP is already projected to rise to the top of its range in recent decades – see chart. The share has been significantly higher in only two years in the post-war period – 1969-70 and 1970-71. Labour Chancellor Roy Jenkins imposed a vicious fiscal squeeze following the 1967 sterling devaluation, probably losing the party the 1970 election. Increased international mobility of capital and labour casts doubt on whether a future Chancellor could achieve a similar tax grab.
UK Autumn Statement: OBR douses Osborne's optimism
Most of the measures in the Autumn Statement had been preannounced, are small in scale and will have limited macroeconomic impact. The main “news” is in the updated Office for Budget Responsibility (OBR) projections. The OBR has refused to endorse the Chancellor’s bullishness, arguing that recent economic and fiscal improvement is entirely cyclical, while growth will slow significantly in 2014. Mr. Osborne will be hoping that its latest forecasts are as unreliable as those made in March.
The OBR grudgingly accepts that the economy has expanded by 2.6% in the year to the fourth quarter of 2013, far ahead of its 1.0% March projection. In contrast to other forecasters, however, it does not believe that stronger momentum will carry over into next year. The OBR maintains its prior assumption of quarterly growth of 0.5% during 2014. This implies that the annual GDP increase will peak at 2.7% in the first quarter and slow to 2.0% by year-end.
The OBR will have further disappointed the Chancellor by ascribing the 2013 growth surprise entirely to cyclical strength, with no contribution from better supply-side performance. With its estimates of productive potential little changed, the negative “output gap” (i.e. the shortfall of actual GDP relative to potential) is judged to have narrowed to 2.2% in the third quarter – below the average estimate of other forecasters. This, in turn, means that the structural budget deficit forecasts are no better – in fact, slightly worse – than in March, despite falling headline borrowing.
The OBR’s bottom line, therefore, is that the Chancellor is doing just enough to meet his “medium-term fiscal mandate” of balancing the cyclically-adjusted current budget five years ahead but has no scope for “giveaways” before the 2015 election. Economic news, moreover, will become less favourable in the run-in to the election, with growth slowing and unemployment levelling off at 7%.
The assessment here is that the OBR is underestimating 2014 growth but overestimating the output gap. Its two formal methods for calculating the gap, indeed, give an average result of 1.3% for the third quarter – this has been overridden by “judgement” to arrive at 2.2%. The key pre-election economic risk for the government, therefore, is rising inflation and an early interest rate hike rather than slowing growth. A smaller output gap, of course, also implies that the structural budget deficit is larger than the OBR estimates – fiscal healing, in reality, has barely begun.

