Entries from December 1, 2013 - December 31, 2013
Global equities closing 2013 strong but country breadth deteriorating
The Santa rally finally arrived: global equities, as measured by the MSCI All Country World index in US dollars, were up by 1.2% from their end-November level as of Friday’s close, and only 4.9% below the all-time high reached in October 2007.
The recent advance, however, reflects gains in a decreasing number of markets. The chart shows the MSCI index together with a breadth measure derived by calculating the percentage of the 44 MSCI constituent countries that rise each week and smoothing this percentage using a 13-week moving average.
The breadth measure peaked in September, at a lower level than a previous high in February. It has failed to recover much recently despite the further rise in the World index.
A similar divergence between index performance and breadth occurred before the 2007-09 bear market and corrections in 2010 and 2011.
Declining country breadth may be a sign that liquidity conditions are deteriorating. Global six-month real narrow money expansion appears to have crossed beneath industrial output growth in November – a shortfall last existed in early 2011. With “excess” liquidity eliminated, price gains for particular assets may depend on diverting funds from other markets, which suffer corresponding weakness.
UK 2013 GDP growth up to 1.9% as monetary velocity rises
Major GDP revisions extending back to the start of 2012 imply that the economy will have expanded by 1.9% in 2013, 0.5 percentage points above the Office for Budget Responsibility’s forecast two weeks ago but in line with the prediction here last December of an increase of about 2%.
GDP is now estimated to have grown by 2.3% between the final quarter of 2011 and the third quarter of 2012, up from 1.7% a month ago. The shortfall from the peak reached in the first quarter of 2008 has narrowed to 2.0%, or 1.0% excluding oil and gas production – the non-oil economy should regain peak output in early 2014.
Based on the new figures, the first estimate of calendar 2013 GDP growth to be released on 28 January will be 1.9% unless fourth-quarter expansion falls below 0.7%.
Faster growth in output since late 2011 has carried over into the current-price GDP numbers, i.e. inflation, as measured by the GDP deflator, is little changed from previous estimates. Current-price GDP grew by a solid 4.5% in the year to the third quarter of 2013, with the deflator up by 2.6%
Robust expansion of current-price GDP in recent years, despite sluggish broad money growth, supports the view here that negative real interest rates are driving a trend rise in the velocity of circulation. Velocity* has increased by 1.3% per annum from a trough reached in the second quarter of 2009 – see chart. If this continues, broad money can grow by no more than about 3.5% per annum to be consistent with the 2% inflation target, assuming potential output expansion of about 2.5%. Current monetary growth – an annual 4.4% in October – is, therefore, too high.
*Velocity is defined here as current-price GDP divided by the break-adjusted level of the money stock six quarters previously – a lag is applied to capture the delayed impact of monetary changes on output and prices.

UK unemployment could hit 7.0% MPC threshold in 2013
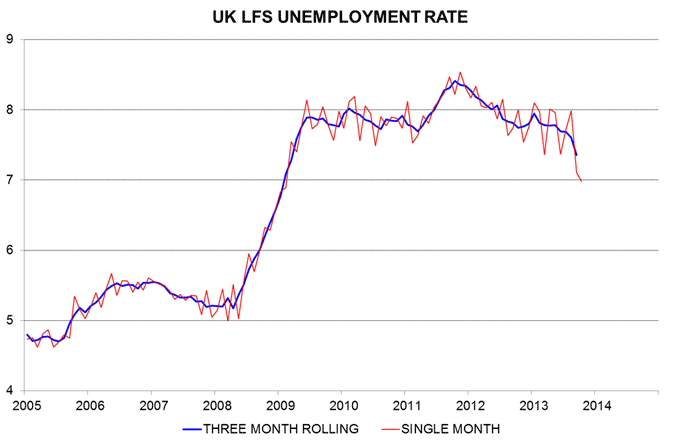
The UK unemployment rate plunged to 7.35% (7.4% rounded) in the three months to October from 7.69% in the prior three months. The single-month estimate for October, moreover, was 6.98%, following 7.10% in September – see first chart. The headline three-month rate, therefore, could hit the MPC’s 7.0% threshold in November or December – at least three years earlier than suggested by the Committee's projections in the August Inflation Report, which accompanied the introduction of forward guidance.
Recent developments are consistent with the view expressed here in July that the unemployment rate was “likely to fall significantly over the remainder of 2013 and, if the trend is sustained, could reach 6.75% in mid-2014”. Such a prospect was obvious from improving trends in job vacancies, business survey labour demand indicators and the claimant count.
Other elements of today’s labour market report were strong. The unemployment fall reflected a surge in employment, while inactivity declined. The alternative workforce jobs measure confirms strong hiring. The employment gain was not dominated by part-timers: average weekly hours were stable. Job vacancies, meanwhile, rose further and the claimant count registered another large monthly decline.
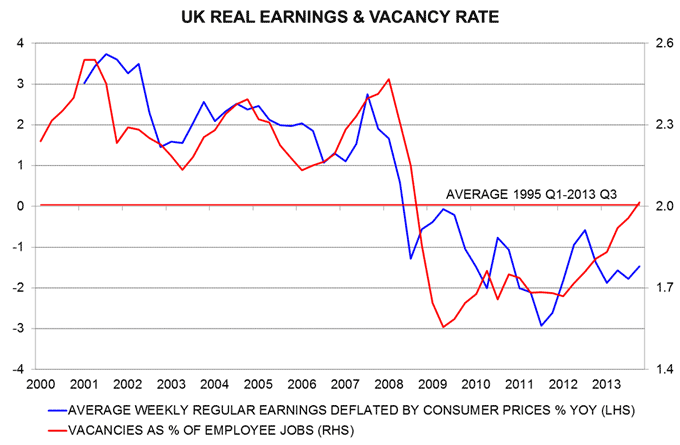
The vacancy rate – i.e. the number of unfilled positions expressed as a percentage of employee jobs – is an employer-based measure of labour market tightness and rose to 2.0% in the three months to November, equal to its average since 1995**. The vacancy rate is positively correlated with the annual rate of change of inflation-adjusted regular earnings: its normalisation suggests that real earnings will resume growth in early 2014 – second chart***.
The return of the vacancy rate to its long-term average casts doubt on the MPC’s estimate that the “medium-term equilibrium unemployment rate” is 6.5%, implying that the actual rate can be allowed to decline well below 7% without generating excessive wage growth.
Aggregate weekly hours worked, meanwhile, rose by 0.9% in the three months to October, roughly matching economic growth – there is no sign, in other words, of the MPC’s assumed productivity revival.
With its unemployment-based forward guidance strategy undermined by another major forecast blunder, the MPC is likely to shift focus to lower-than-expected inflation and sterling strength as excuses for delaying necessary monetary policy tightening.
*The modal and mean projections in the August Report for the third quarter of 2016 were 7.1% and 7.4% respectively.
**The vacancy rate was estimated before the second quarter of 2001 by linking the current employer survey based vacancies series with an earlier series, ending in the first quarter of 2001, covering vacancies at job centres. This linking assumes that 1) the vacancy rate was unchanged between the first and second quarters of 2001 (reasonable – unemployment was little changed between the two quarters) and 2) job centre vacancies were a constant proportion of total vacancies from 1995 to 2001.
***Quarterly data except for the final points, which refer to the latest three months.


UK inflation as expected; monetary trends signalling 2014 rise
UK consumer price inflation fell from 2.2% in October to 2.1% in November, in line with a projection in a post a month ago and the lowest since November 2009. The decline was due to smaller 12-month increases in food and energy utility prices. The utility effect will reverse in December as recently announced tariff rises are implemented.
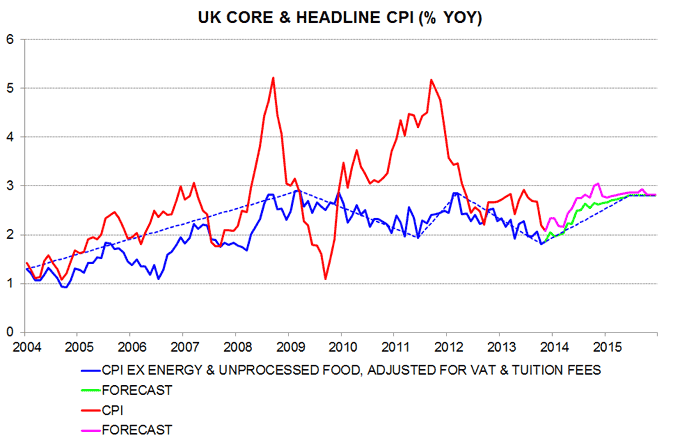
The focus here is on “core” inflation, i.e. excluding energy and unprocessed food and adjusted for the impact of changes in VAT and student tuition fees. As expected, this recovered from 1.8% in October to 1.9%. A post in August related the decline in core inflation from a peak of 2.9% in March 2012 to a slowdown in money growth between March 2010 and August 2011 – monetary changes lead prices with a long and variable lag averaging about two years, according to the monetarist rule-of-thumb. The core rate was projected to bottom in October 2013 and trend higher during 2014 in lagged response to money supply acceleration over 2011-13 – see first chart.
The forecast for the headline CPI increase assumes that the “wedge” with core inflation remains around its current level, with slower increases in food and energy utility prices next year offset by motor fuel costs resuming an upward trend. CPI inflation is projected to average 2.25% over December-March before embarking on a core-driven upswing next spring, reaching more than 3% in late 2014 – second chart.


Is the Fed overestimating economic slack?
The Federal Reserve will probably begin to “taper” its securities purchases this week while redoubling its efforts to convince markets that official rates will remain at a rock-bottom level for a prolonged period. The latter strategy reflects a judgement that spare capacity is still substantial, implying that the economy can grow strongly without generating inflationary pressure.
This view, however, is questioned by two items of evidence. First, in the labour market, the vacancy rate – i.e. unfilled job openings as a percentage of employment – is now slightly above its average since 2001* (2.9% versus 2.7%). If effective labour supply were much higher than demand, as the Fed believes, employers would find it easy to fill job openings and the vacancy rate would be low and stable.
The first chart compares the unemployment and vacancy rates, the latter plotted inverted, with the scales adjusted to align the averages of the two series (horizontal lines). The unemployment rate remains 0.4 percentage points above its average since 2001 (7.0% versus 6.6%). The divergence with the vacancy rate suggests that the “natural” rate of unemployment has risen significantly.
Secondly, business surveys indicate that capacity utilisation within firms is normal. The second chart shows the OECD’s estimate of the “output gap” (i.e. deviation of GDP from potential) together with a weighted average of manufacturing and non-manufacturing utilisation rates from the Institute for Supply Management (ISM) semi-annual survey – the latest such survey was released last week. The ISM utilisation measure has recovered all of its recession-induced fall and is above average, casting doubt on the gap estimates of the OECD and others.
Limited slack suggests that price and wage pressures will revive sooner than the Fed and the consensus expect if the economy continues to expand at its recent pace.
*Series starts in December 2000.


UK construction revision boosts 2013 growth
Upward revisions to construction output released today are likely to prompt a further round of upgrades to 2013 GDP growth estimates, consistent with the long-standing view here that the economy will eventually be shown to have expanded by about 2% this year.
Construction output is now estimated to have risen by 4.8% between the fourth quarter of 2012 and the third quarter of 2013, a substantial change from 2.2% a month ago. With construction accounting for 6.3% of GDP, this implies that the latter grew by 2.00% rather than 1.84% between the two quarters, assuming no revisions to output in other sectors. Revised GDP figures are released next week.
Construction, moreover, is on course to make another solid contribution to fourth-quarter GDP expansion. The October level of output was 2.0% above the third-quarter average and, if sustained, implies that the sector will add 0.13 percentage points to the change in GDP this quarter.
The Office for Budget Responsibility last week projected a 1.4% rise in GDP in 2013 based on assumed 0.7% growth in the fourth quarter. Today’s construction revision suggests a full-year number of 1.5%, maintaining the fourth quarter assumption. The latter, however, seems low relative to other evidence – 0.9% growth would generate a full-year GDP increase of 1.6%.
The revisions process remains at an early stage and the expectation here is that the numbers for the dominant services sector will be raised over coming months, bringing 2013 GDP growth up towards 2.0%.

