
Entries from August 1, 2016 - August 31, 2016
China data summary: more positives than negatives
 Simon Ward
 Post a Comment
Chinese activity and money / credit data for July were mixed but are interpreted here as supporting a positive view of near-term prospects.
Annual industrial output growth edged lower in July but the six-month rate of increase rose to its strongest level since 2014, based on the World Bank’s seasonally-adjusted level series – see first chart. A rebound in steel output has contributed to the recent pick-up and may be a positive signal for prospects – steel output is a component of the OECD’s Chinese leading indicator.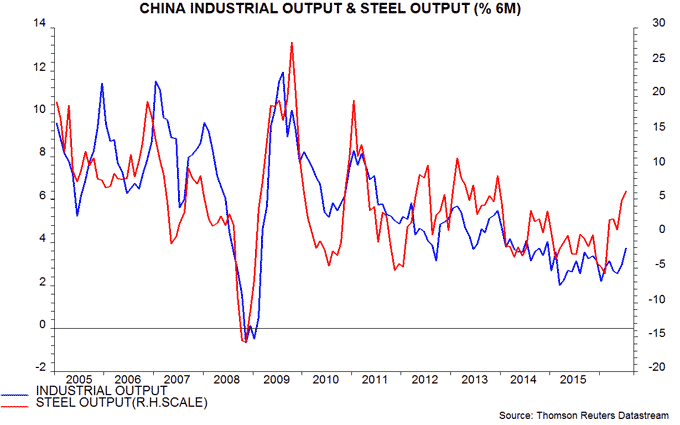
The rise in six-month industrial output growth accords with the Markit / Caixin manufacturing purchasing managers’ index, which moved above the 50 level last month for the first time since February 2015.
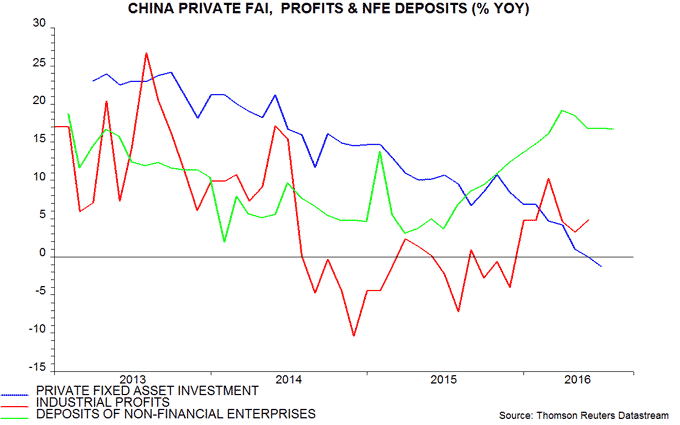
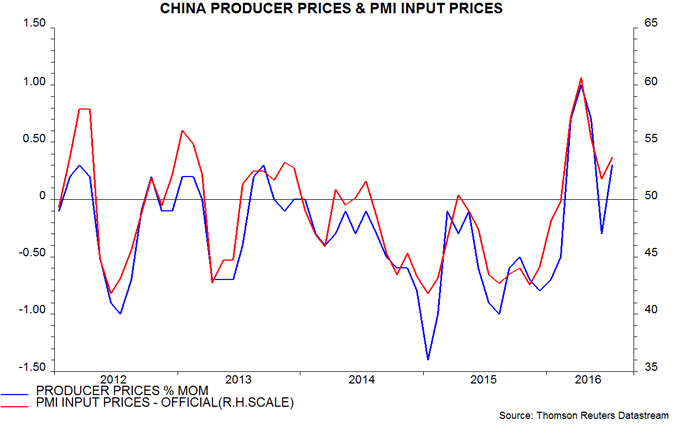
Pessimistic commentary has focused on a further slowdown in fixed asset investment, with the private sector component contracting in the year to July – second chart. The working assumption here is that private investment has been adjusting to lower economic growth and a fall in profits in 2014-15. With profits now recovering, and non-financial enterprise deposits rising strongly, a turnaround may be imminent – third chart. The profits rebound partly reflects an easing of deflationary pressures, with producer prices rising in four of the last five months – fourth chart.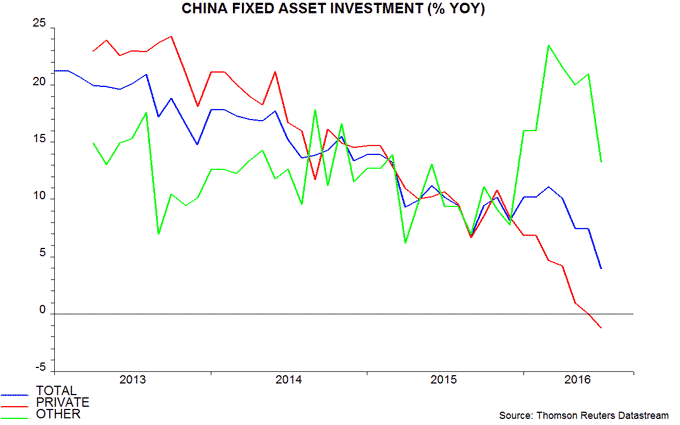
Annual growth in housing sales and starts peaked in March but has remained positive, recovering slightly in July – fifth chart.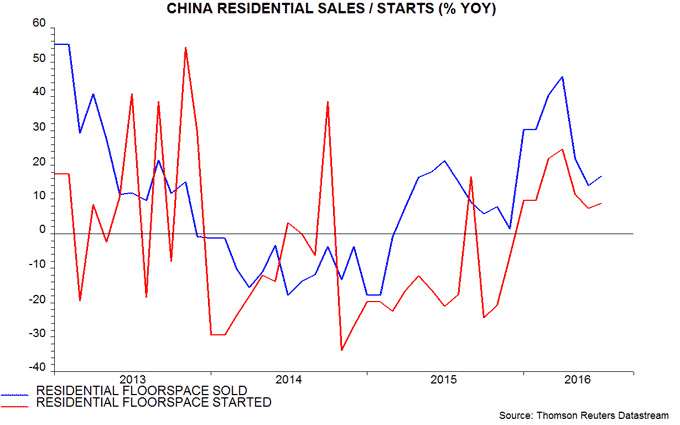
Exports could provide a fillip during the second half. The average level of the renminbi against the PBoC’s currency basket so far in August is 7.5% lower than during the second half of 2015, while global demand appears to be firming. A recent recovery in container freight rates, as measured by the Shanghai shipping exchange’s composite containerised freight index, is a promising sign – sixth chart.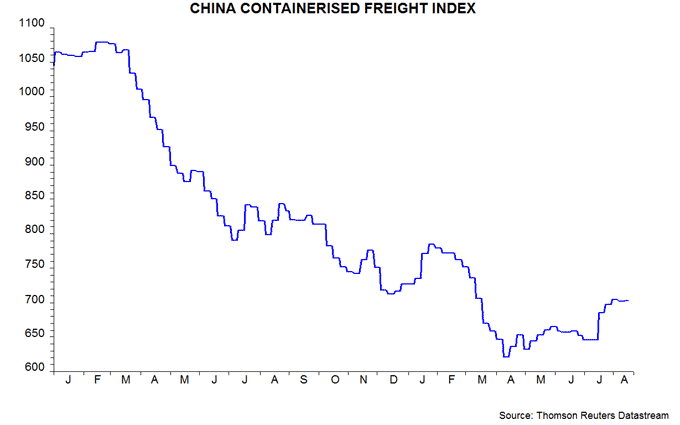
Narrow money growth remains buoyant: the annual rise in true M1, comprising currency in circulation and demand / temporary deposits of non-financial enterprises, government organisations and households, edged up to 21.8% in July, the highest since 2010 – seventh chart*. It has been argued that demand deposits have been boosted by side-effects of the local government debt swap programme and rapid expansion of wealth management products but such explanations cannot account for the extent and persistence of recent strength. Household as well as corporate deposits have grown robustly – up by an annual 15.0% in July.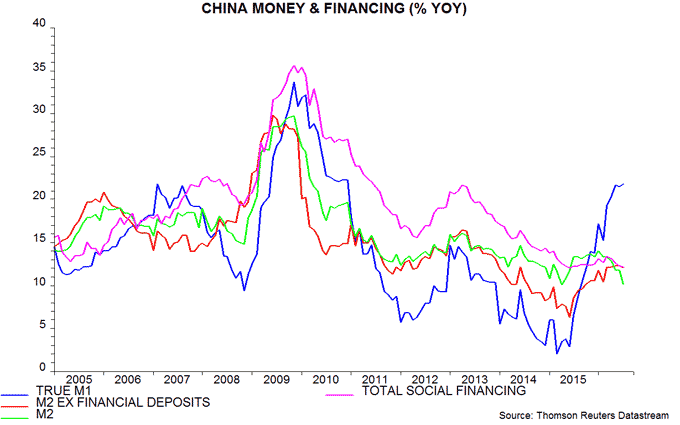
Annual growth of the broader M2 measure fell to 10.2% in July, a fifteen-month low, but the recent decline is entirely explained by deposits of non-bank financial institutions – these surged in 2014-15 but are now contracting. Swings in such deposits are unlikely to be relevant for assessing immediate economic prospects. M2 excluding financial-sector deposits, by contrast, has accelerated over the past year: annual growth of 12.3% in June was the strongest since 2013, with July little changed at 12.1% – seventh chart.
The preferred aggregates here, therefore, suggest that annual nominal GDP growth will continue to recover during the second half, following a rise from 6.0% to 7.3% between the third quarter of 2015 and the second quarter of 2016 – eighth chart.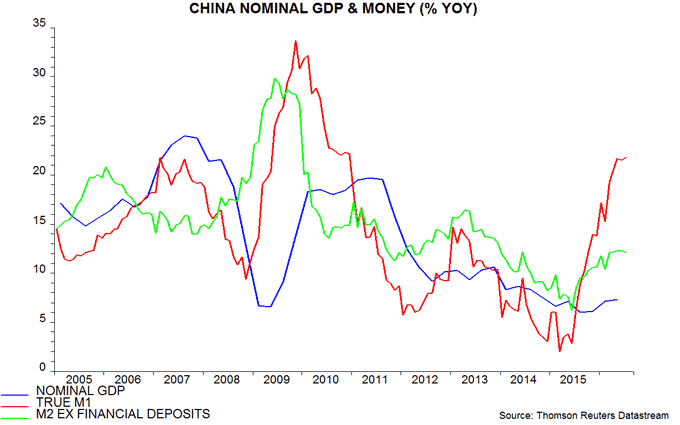
*The official M1 aggregate omits household deposits.
EM money trends still positive
Posts here in late 2015 and early 2016 argued for a positive stance on emerging economies and equity markets because 1) narrow money trends in the “E7” large economies had strengthened, signalling a recovery in growth during the first half of 2016, and 2) US money trends, by contrast, had weakened, suggesting reduced upward pressure on US interest rates and the dollar – this was expected to bring relief to China and other countries suffering capital outflows.
E7 economic growth has, indeed, rebounded since end-2015, with money trends suggesting a further pick-up. US / G7 money developments are also now positive. US rates, however, may soon be under renewed upward pressure from firmer economic data and a continued rise in wage growth. This suggests remaining positive on emerging markets but tilting equity market exposure towards “cyclical” markets that benefit disproportionately from stronger global growth while reducing weightings in “interest-rate-sensitive” markets that have correlated positively with US / domestic bond prices historically.
Six-month growth of E7 real (i.e. consumer price-deflated) narrow money began to surge in mid-2015, suggesting stronger economic momentum in spring 2016, allowing for an average nine-month lead. Non-monetary leading indicators confirmed this signal in early 2016. Six-month growth of E7 industrial output rose sharply in May, maintaining a stronger level in June. Real money growth, meanwhile, has risen further, reaching its highest level since 2010 – see first chart.
The increase in E7 real narrow money growth in late 2015 contrasted with a slowdown in the G7, resulting in the E7 / G7 gap turning significantly positive. As noted at the time, emerging equity markets have outperformed developed markets on average historically when the E7 / G7 gap has been positive, underperforming when it has been negative. A rebound in G7 real money growth during the first half of 2016 has narrowed the gap but it remains in favour of emerging equities – second chart.
The rebound in emerging-world economic growth is feeding through to profits. The equity analysts’ earnings revisions ratio – upgrades minus downgrades expressed as a percentage of the total number of estimates – for constituents of the MSCI emerging markets index has risen to zero, its highest level since 2011. (The average level of the ratio historically has been significantly negative, reflecting analysts’ bias towards over-optimism.) The ratio for the MSCI World developed markets index remains negative but is recovering – third chart.
US economic growth is expected here to speed up significantly in the second half – see previous post. Wage pressures, meanwhile, may increase further. Annual wage growth has tended to rise or fall in recent decades depending on whether the job openings (vacancies) rate has been above or below 3.0% (its average since 1990). The openings rate remains well above this level currently, at 3.8% in June – fourth chart. 
The Federal Open Market Committee, therefore, could raise interest rates earlier and by more over the next six to 12 months than markets currently discount. Upward pressure on US rates could boost the dollar and cause capital outflows from emerging markets to pick up again.
The judgement here is that a return to a vicious cycle of capital outflows, currency weakness and equity market underperformance is unlikely because domestic monetary and economic conditions are much more favourable than in 2014-15. A synchronised pick-up in E7 and US economic growth, moreover, could boost commodity prices.
The suggested scenario could favour those markets that have performed better historically when global growth is strengthening (“cyclical” markets) at the expense of those with greater (negative) sensitivity to US / domestic bond yields (“interest-rate-sensitive” markets). Analysis of relative returns since 2005 places Brazil, Hungary, India, Indonesia and Russia in the cyclical grouping, with Chile, Colombia, Malaysia, Philippines and South Africa classified as interest-rate-sensitive. (Other markets have been “averagely” sensitive to the two factors.) Monetary trends, among other considerations, should also be taken into account in assessing the relative attraction of a particular market.
UK vacancies / money data key for assessing Brexit impact
The working assumption here is that the UK economy has slowed sharply but will continue to grow over coming quarters. In assessing the validity of this assumption, particular weight will be given to 1) official vacancies data, which should give an early signal of any contraction, and 2) narrow money trends, which are relevant for assessing spending intentions and prospective activity six to 12 months ahead. July vacancies and money supply numbers will be released on 17 and 30 August respectively.
A default view of continued expansion, rather than stagnation or recession, is adopted because 1) robust monetary trends at mid-year suggest that economic prospects were solid before the Brexit vote shock, 2) global momentum is judged to be strengthening, with positive implications for UK activity via trade and confidence effects, and 3) domestic financial conditions have loosened since the vote – an assumed tightening was a key component of “Project Fear” negative economic scenarios.
The default view is challenged by the plunge in the PMI composite output index in July to a level consistent – according to the index compilers – with economic contraction. Historical evidence, however, suggests that the PMI overreacts to “shocks” – plunges to similar levels occurred in 1998 (Russian default / LTCM crisis), 2001 (New York terrorist attacks) and 2003 (Iraq war) but economic expansion continued. The current level of the output index is less important than whether it stages an early recovery, as it did after the prior shocks – see first chart.
An alternative survey-based measure with a shorter history but a similar correlation with contemporaneous quarterly GDP / GVA* changes is the CBI’s expected growth indicator, based on its polls of services, manufacturing and distribution that feed into the EU Commission’s economic sentiment gauge. The July reading of this indicator was above a level suggestive of economic contraction – second chart.
An important question, therefore, is whether the current divergence of the PMI and CBI indicators will be resolved by the former recovering or the latter sliding further.
The PMI and CBI indicators represent “soft” economic data – they are diffusion indices of “better” versus “worse” responses, rather than measures of the magnitude of economic change. The first significant “hard” (quantitative) data to be released for July will be claimant-count unemployment and vacancies (three-month moving average), due on 17 August. July output numbers will not be available until next month – industrial, construction and services data are scheduled for release on 7, 9 and 30 September respectively.
The vacancies series, in particular, should provide an early warning if the default view here is wrong and the economy is starting to contract. The third chart shows vacancies and claimant-count unemployment over 2008-09. GDP fell from a peak in the first quarter of 2008 to a trough in the second quarter of 2009. Vacancies tracked this decline, moving from a high in February 2008 to a low in May / June 2009.

Claimant-count unemployment is a useful confirming indicator but lags vacancies – businesses can adjust their recruitment plans instantly but take time to shed workers. Unemployment started to rise in April 2008 – one month after vacancies began to fall – and continued to climb until October 2009.
The timely recession signal from the vacancies series in 2008 is further illustrated by the fourth chart. Based on the estimated relationship, a contraction in GDP / GVA would be suggested if vacancies fell by 4% or more over three months. There were 747,000 vacancies in the three months to June, so this implies a decline of 30,000, or 10,000 per month. 
The official vacancies series will be the focus of attention here but a monthly fall on this scale is not suggested by the July reading of the Reed job index, a tally of online listings on reed.co.uk, the UK’s largest job board. The fifth chart compares this index, and an earlier online jobs measure compiled by Monster (discontinued in 2012), with the official series**. The Monster / Reed indices have exhibited stronger trend growth, reflecting a structural shift towards online recruitment, but have broadly tracked the official series: the peak and trough months of the Monster index in 2008-09 were the same (February 2008 and June 2009). The Reed index fell slightly between May and June but was little changed in July.
*GVA = gross value added.
**The Monster / Reed indices have been seasonally adjusted.
UK "Term Funding Scheme": reasons for caution
Media reports have overhyped the new Term Funding Scheme (TFS), under which the Bank of England will supply medium-term funds to banks at Bank rate as long as they maintain or expand their lending.
Some reports have described the scheme as a “giveaway” or “subsidy” to banks. It is not. The Bank will fund the scheme by creating new bank reserves, which earn interest at Bank rate. The net cost of the scheme to the Bank (ignoring administrative expenses), therefore, will be zero. There is no “giveaway”.
Usage of the scheme, according to the Bank, “could reach around £100 billion”. Some reports have added this figure to the £70 billion of planned purchases of gilts and corporate bonds, claiming that the Bank has launched a £170 billion “money-printing package”. Usage, however, may fall well short of £100 billion, while the scheme will be used mainly to replace existing funding, not to finance new lending. It is not equivalent to QE.
Many banks are holding “excess” reserves at the Bank relative to their regulatory or operational needs. These banks could use these reserves, earning Bank rate, to exploit any profitable lending opportunities – they have no need or incentive to access the TFS. Their lending, therefore, is unlikely to be affected by the scheme.
The scheme is targeted at liquidity-short banks and building societies, which will be able to use it to replace more expensive wholesale and retail funding and, possibly, to increase lending*. The positive impact on the margins of these institutions, however, comes at the expense of not the Bank but rather their wholesale / retail depositors, whose funds will earn lower rates elsewhere.
Even these banks / building societies may have reservations about accessing the scheme, since Governor Carney has suggested that the Bank will expect to have a significant say over their loan pricing decisions. The banks, he said, have “no excuse” not to pass on the quarter-point Bank rate cut in full and the Bank “will be watching” to ensure that they do.
The combined impact of the Bank rate cut and TFS, therefore, may be negative for banks – margins of banks with excess reserves may be squeezed, while those accessing the scheme may lose autonomy over other decisions affecting their profitability. The scheme is unlikely to stimulate much additional lending. Its main effect will be to increase the pass-through of the Bank rate cut to borrowers and, particularly, depositors.
*To the extent that profitable lending opportunities exist that have not been exploited by banks with excess liquidity.
UK MPC running risks with inflation
The MPC’s easing package exceeded expectations but falls short of representing a “sledgehammer”.
The MPC supplemented a quarter-point Bank rate cut with purchase programmes of £60 billion of gilts over six months and £10 billion of corporate bonds over 18 months. The implied monthly rate of buying of £10.6 billion, however, compares with £25 billion when QE was introduced in March 2009. The nominal size of the economy has grown by a quarter since 2009, so monthly buying as a percentage of GDP will be only one-third of the level in 2009.
The novelty in the package was the introduction of a Term Funding Scheme, which replaces the Funding for Lending Scheme and will allow banks to access medium-term funding at Bank rate as long as they maintain or expand their net lending. The purpose of the scheme, however, is to ensure that the Bank rate cut feeds through to lending rates by offsetting the negative impact on banks’ margins; it does not represent an additional stimulus measure.
The package also contained forward guidance that the MPC will cut rates to the lower bound, judged to be ”close to, but a little above, zero” if the economy evolves in line with the Inflation Report forecast, which envisages “little growth” in the second half of 2016. Governor Carney, however, stated that he is not in favour of a move to negative rates, and there was no discussion in the minutes of this possibility.
The judgement here is that there is insufficient evidence, in particular about post-referendum money and credit trends, to warrant additional easing at this stage. The MPC is playing fast and loose with the inflation target, launching stimulus despite forecasting that the annual CPI rise will be above the 2% target in 2018-19. If demand holds up better than expected, or the Brexit supply shock proves larger, a significant inflation overshoot may be in prospect.
US H2 growth signals positive
A post in October 2015 argued that US economic growth would undershoot consensus expectations because 1) narrow money trends, which lead activity by six to 12 months, had weakened sharply and 2) the level and rate of change of inventories were elevated relative to sales / output, suggesting that the three to five year Kitchin stockbuilding cycle was about to turn down (having last bottomed in 2012).
These reasons for pessimism have now reversed. Six-month growth of real narrow money, defined as currency in circulation plus demand deposits divided by consumer prices, has risen from a low of 0.2% (not annualised) in October 2015 to 4.4% in June.
The rate of change of inventories, meanwhile, turned negative in the second quarter, a drawdown having last occurred in the third quarter of 2011. It would be premature to declare the Kitchin downswing over, since the level of stocks remains elevated relative to sales – see first chart. The large GDP growth drag from inventories during the first half, however, is unlikely to be repeated.
A further reason for optimism is an improving profits backdrop. Last week’s GDP release contained a significant upward revision to the level of profits in recent quarters, along with a stronger rebound in the first quarter. A second-quarter number is not yet available but a further increase is implied by faster growth of nominal GDP (3.5% annualised) than employee compensation (2.6%) – second chart. Together with lower corporate financing costs, this may contribute to a rebound in business investment.
What are the risks? One is that slow first-half growth feeds through to weaker near-term employment gains, undermining consumer spending, which has been a recent bright spot. July consumer surveys, however, do not suggest much pull-back: the expectations component of the Conference Board confidence measure, for example, remains consistent with solid spending expansion – third chart.
A second risk is that wages continue to pick up in response to a tight labour market, aborting the recent profits recovery. Annual growth in the wages and salaries component of the employment cost index rose to 2.5% in the first quarter, equalling a high reached in the first quarter of 2015. The latter was boosted by unusually large bonus / incentive payments: excluding incentive-paid occupations, wage growth is on a strong upward trend – fourth chart.
A probable rebound in GDP growth coupled with rising wage pressures argues for a central scenario in which the Federal Open Market Committee raises the target funds rate during the second half, with a September move still possible.
