
Entries from August 1, 2016 - August 31, 2016
UK CBI business surveys suggesting slowdown not recession
 Simon Ward
 Post a Comment
The CBI’s expected growth indicator – a weighted average of business expectations from its manufacturing, distribution and services surveys – is likely to have recouped part of its July loss in August, based on already-released data. The current level of the indicator is consistent with weak economic expansion.
The expected growth indicator slumped from +16% in June to -3% in July but even the latter was above a level suggesting economic contraction, based on historical evidence. The indicator is estimated to have recovered to about +4% in August, reflecting gains in all three component surveys, with a particularly large rebound in retail / wholesale trade expectations – see chart*.
The historical correlation of the CBI indicator with quarterly GDP / gross value added (GVA) changes is similar to that of the more widely-followed composite PMI output index, the July level of which was consistent with quarterly contraction of 0.4%, according to the index compilers. The CBI indicator suggests that the PMI will recover in August but it may remain below the “breakeven” 50 level, partly because its coverage excludes distribution.

*The CBI indicator values in the chart have been seasonally adjusted. Seasonal influences appear to have contributed to the large fall in the indicator in July.
UK money data reassuring, no case for rate cut
UK monetary data for July showed no negative impact from the Brexit vote. Narrow and broad money rose solidly on the month, while bank lending continued to expand. The suggestion is that the economy remains on a growth path with little risk of a recession. There is no monetary case for a further cut in Bank rate.
The favoured narrow and broad money measures here are “non-financial” M1 and M4, comprising money holdings of households and private non-financial corporations (PNFCs). These measures grew by 1.0% and 0.6% respectively in July, while bank lending to households and PNFCs gained 0.2%. Non-financial M1 rose by 9.6% in the latest 12 months, with non-financial M4 up by 6.6% – see first chart.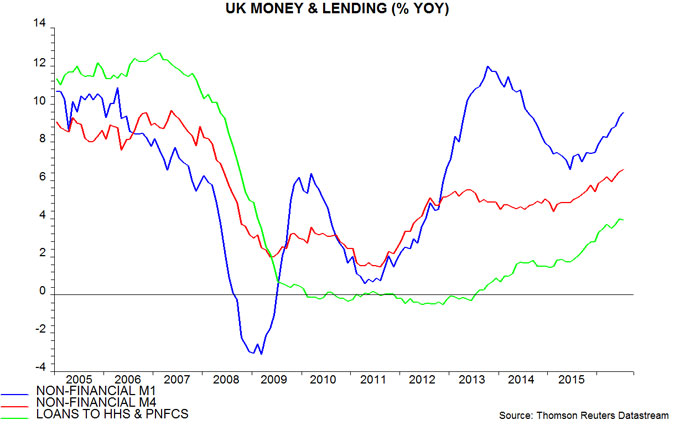
An oncoming recession would be expected to be signalled by a contraction of narrow money holdings, associated with households and firms revising down spending plans and / or receiving less income than expected. Both household and PNFC M1 rose solidly in July, by 1.0% and 1.1% respectively.
The forecasting approach here focuses on the six-month change in real (i.e. inflation-adjusted) non-financial M1. A rise in this measure in late 2015 correctly signalled that GDP / gross value added (GVA) momentum would pick up into mid-2016. Real non-financial M1 growth may have peaked in June but remained strong in July – second chart.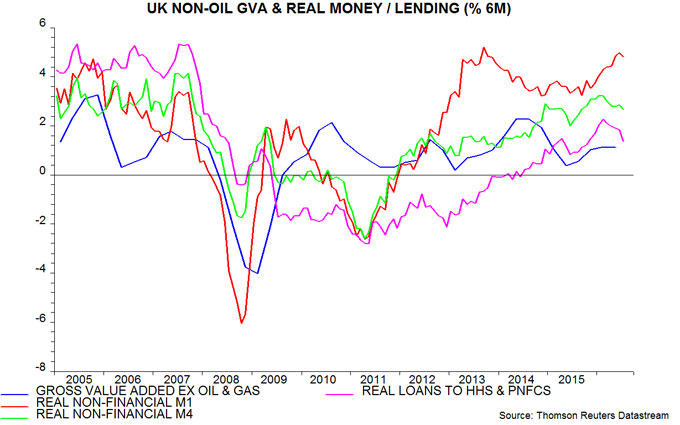
Six-month growth of real non-financial M4, meanwhile, has fallen since February 2016 but remains above its average in recent years.
Taken together, these developments suggest that GDP / GVA expansion will moderate from its first-half pace while remaining respectable.
Economic behaviour, of course, has only started to adjust to Brexit uncertainties and monetary trends could weaken significantly over coming months. For the moment, however, recession risk appears low: the six-month change in real non-financial M1 has turned negative before all previous recessions over the past 60 years.
Annual growth of the Bank of England’s preferred broad money measure, M4ex, surged to 6.9% in July, above the 6.6% expansion of non-financial M4 – third chart. M4ex includes financial-sector money holdings, which have picked up strongly, rising by an annual 9.3% in July. This pick-up follows an extremely rapid increase in bank lending to the financial sector, annual growth of which peaked at 36.1% in June. The strength of both lending and deposits has been concentrated in “fund management activities” and may reflect the implementation of liability-driven investment strategies on behalf of pension funds. These financial-sector developments, in any case, are probably of little significance for future spending on goods and services. 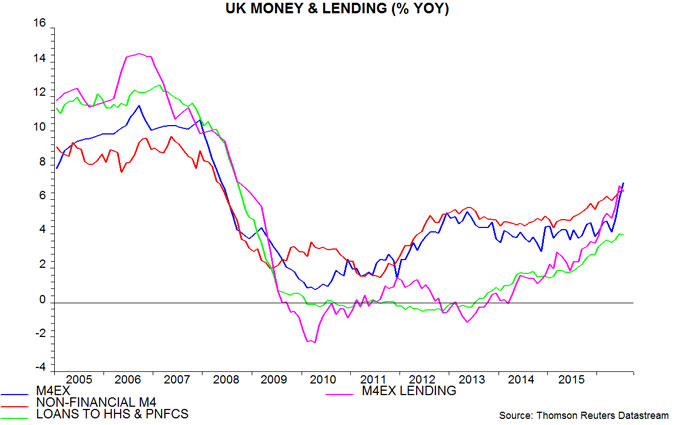
Japanese equities supported by money trends, demand / supply
Japanese equities have underperformed the US and emerging markets in common currency terms so far in 2016, while faring slightly better than UK and continental European stocks. Monetary trends and demand / supply considerations suggest that relative performance will improve.
GDP rose by just 0.05% in the second quarter but this may represent payback for a 0.5% first-quarter gain, which may have been flattered by a statistical leap-year effect. Two-quarter growth moved up to 0.55%, or 1.1% at an annualised rate, the fastest since the second quarter of 2015. Monetary trends are signalling a further rise, with six-month growth of real narrow money M1 surging since the Bank of Japan (BoJ) introduced a negative rate on the top tier of bank reserves in February, and real M2 / M3 expansion also firming – see first chart.

Faster growth of M1 than broader aggregates normally signals that companies and consumers are shifting their monetary savings into more liquid form ahead of boosting their spending. A similar divergence occurred in the Eurozone after the ECB cut the deposit rate to negative in June 2014 and was followed by significantly stronger domestic demand and GDP growth in 2015. (As an aside, a recent claim that the current wide gap between M1 and M2 growth in China is evidence of a “liquidity trap” and has negative economic implications has no basis in monetary theory and is not supported by international historical evidence.)
Six-month growth of real narrow money is now higher in Japan than in most other developed economies, suggesting greater potential for a positive economic surprise, which could boost relative equity market performance – second chart.

The demand / supply backdrop, meanwhile, appears favourable. The BoJ has been buying at a weekly average rate of ¥69 billion over the latest three months but last month’s decision to raise the annual target for equity ETF purchases from ¥3.3 trillion to ¥6.0 trillion implies a step-up to ¥115 billion – third chart. ¥6.0 trillion is equivalent to 1.9% of the market capitalisation of the TOPIX index (free float basis).

Business corporations, meanwhile, have been buying shares at a weekly rate of ¥51 billion over the latest three months, while issuance averaged only ¥19 billion a week in the three months to July.
There is additional “structural” demand from the Government Pension Investment Fund (GPIF) and other public schemes. The GPIF’s weighting in domestic equities stood at 23.35% at end-December, the latest available date, versus its target range of 25% plus or minus 9 percentage points. Public pension funds in aggregate bought equities at a weekly rate of ¥74 billion in the first quarter, according to the BoJ’s flow of funds accounts.
The combination of BoJ QE demand, corporate float shrinkage and public fund buying suggests upward pressure on prices unless foreign investors or individuals dump shares. Foreigners, however, have reduced exposure significantly since May 2015 and may be underweight, in aggregate, relative to benchmarks. They may be forced to buy if the market starts to outperform.
Individuals tend to accommodate swings in foreign demand but they may be reluctant to sell at current prices owing to a lack of appealing alternatives, with government bond yields negative but rising, and foreign investments at risk from further yen strength.
The suggestion is that higher prices will be required to balance the net demands of the various sectors.
Global economy accelerating, money signal still positive
Global economic growth continues to strengthen, consistent with a forecast based on narrow money trends, which remain positive.
Global economic momentum is measured here by the two-quarter / six-month change in GDP or industrial output in the G7 major economies and seven large emerging economies (the “E7”*). The G7 plus E7 grouping dominates the global economy, accounting for two-thirds of GDP measured at “purchasing power parity” and nearly three-quarters in current US dollars**. Measuring changes over two quarters / six months is judged to optimise the trade-off between timely signals and noise.
Two-quarter growth in G7 plus E7 GDP is estimated to have risen from 1.1% in the first quarter to 1.2% in the second, or 2.4% at an annualised rate. Six-month industrial output growth, meanwhile, jumped to 1.1% in June, or 2.2% annualised, the fastest since February 2015 – see first chart.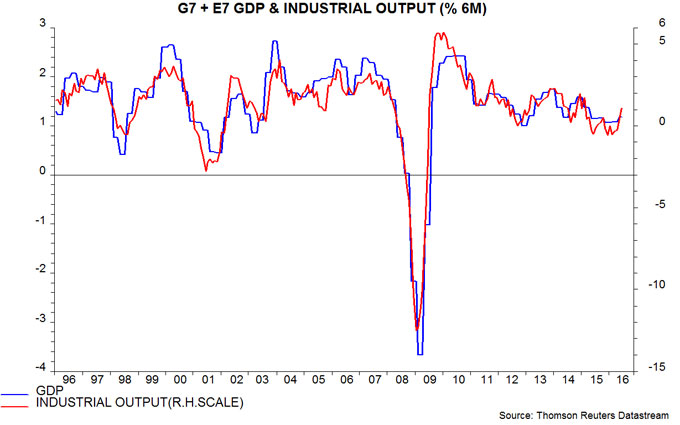
GDP and industrial output changes are closely correlated, with June six-month output growth consistent with annualised GDP expansion of about 2.75%. GDP momentum, therefore, was probably still firming as the second quarter ended.
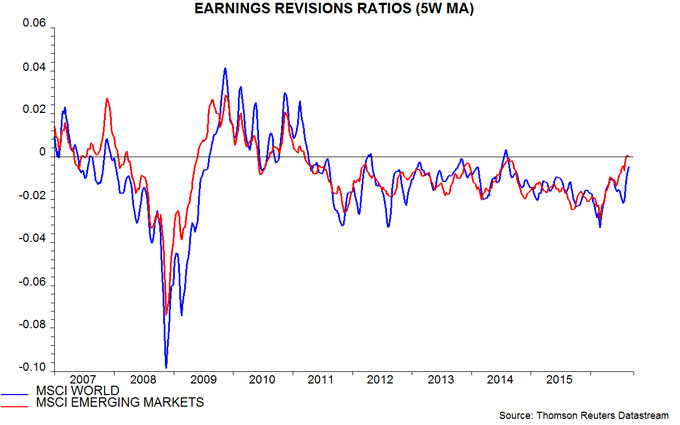
The US and China have released July industrial output data; six-month growth rose further in both cases. Additional positive signals are a further pick-up in six-month expansion of world steel output in July and a sharp increase in the equity analysts’ earnings revisions ratios for developed and emerging markets in July / August – second and third charts.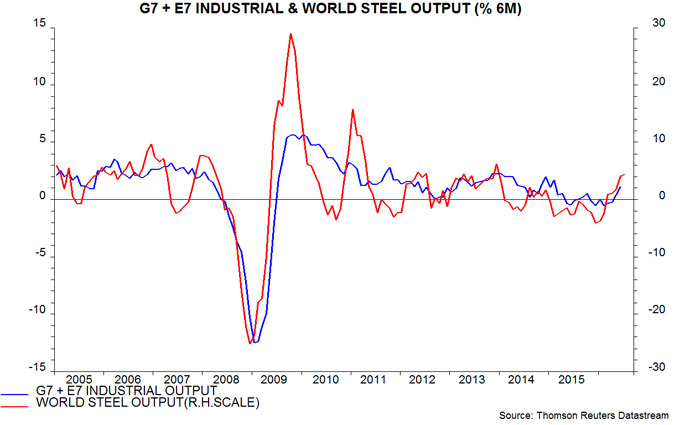
A summer revival in economic growth had been predicted by a rise in six-month G7 plus E7 real narrow money expansion from a low in August 2015 – real money turning points lead those in industrial output by nine months on average, according to a study of G7 data since the 1960s. Six-month growth of real narrow money continued to increase during the first half of 2016, reaching 5.2% in June, or 10.7% annualised, the fastest since 2009. It appears to have remained strong in July, judging from data for countries covering two-thirds of the G7 plus E7 aggregate – fourth chart. The suggestion is that the current cyclical upswing will extend through spring 2017, at least.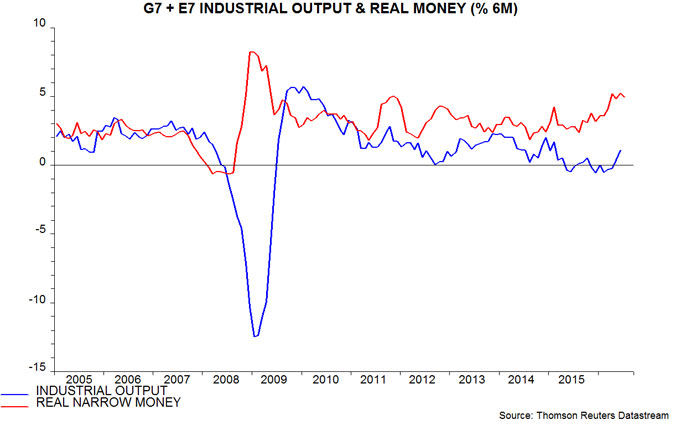
The forecasting approach here seeks confirmation for monetary signals from the OECD’s composite leading indicators, which combine a range of non-monetary forward-looking data. The OECD, bizarrely, suspended publication of its entire suite of indicators in response to the UK's Brexit vote – the most recent numbers are for April with data for May, June and July due to be released in early September. The OECD’s calculation method has been replicated to estimate its G7 “normalised” leading indicator, designed to signal whether future economic growth will be above-or below-trend. The indicator appears to have bottomed in April, edging higher in May and June, with early data suggesting a further increase in July – fifth chart. It is not possible to replicate the OECD’s E7 calculations (because the organisation does not release historical data on components) but the behaviour of the G7 indicator is consistent with an economic upswing.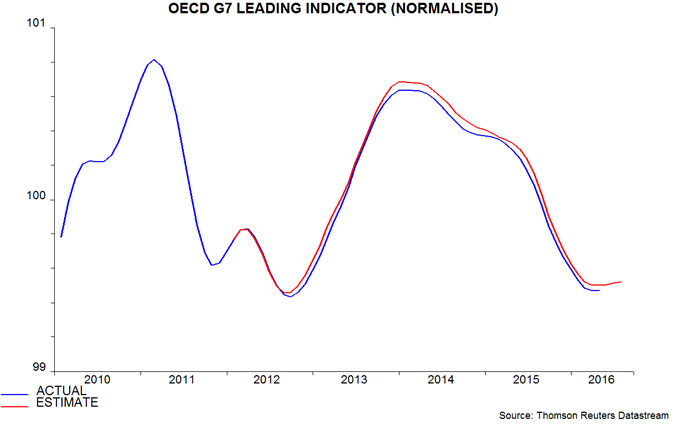
The forecast of significantly stronger global economic growth questions current consensus narratives about “secular stagnation”, low / negative “natural” levels of interest rates and the need for fiscal stimulus. A positive growth surprise could be the catalyst for a narrowing of the current wide gap between government bond yields and the level suggested by actual economic performance – sixth chart.
*Defined here as BRIC plus Mexico, Korea and Taiwan.
**Averages of PPP and current US dollar GDP weights are used to calculate the G7 plus E7 aggregates.
US business investment reviving
The suggestion in a previous post that a recovery in US business investment will contribute to significantly stronger second-half GDP growth is supported by July industrial output data.
Equipment spending accounts for 46% of business investment (i.e. private non-residential fixed investment). Six-month growth of industrial output of business equipment rose to 2.0% in July, the fastest since 2014. Output and investment numbers are, unsurprisingly, closely correlated – see first chart.
Structures investment accounts for a further 21% of the business total and has been even weaker than equipment spending, mainly reflecting a collapse in mining exploration. The industrial output component covering oil and gas well drilling, however, bottomed in May, edging higher in June and July. The recovery in the oil price, meanwhile, suggests a significant rebound in both output and investment over the remainder of 2016 – second chart.
Spending on “intellectual property products”, mainly software and R&D, accounts for the remaining 33% of business investment; it continues to grow strongly.
Business investment fell by 1.4% during the first half (i.e. between the fourth quarter of 2015 and the second quarter of 2016), subtracting 0.18 percentage points (pp) from GDP growth, or 0.36 pp at an annualised rate. A reasonable base case is that this decline will be fully reversed during the second half, implying that business investment alone could contribute 0.72 pp to the change in annualised GDP growth between the first and second halves.
The change in inventories subtracted a further 0.79 pp from annualised GDP growth during the first half but is expected here to have a neutral impact at worst during the second half . Total business spending, therefore, may deliver a boost of more than 1.5 pp to second-half GDP expansion.


UK vacancies softer but not suggesting economic contraction
UK vacancies data covering July suggest that the economy has slowed sharply but is not contracting – contrary to the recessionary message from the high-profile but often unreliable purchasing managers’ surveys, which appear to have played a key role in the MPC’s decision to launch further policy easing.
The vacancies numbers are reported on a three-month moving average basis. The average fell from 744,000 in June to 741,000 in July, a decline of 0.4%. A previous post argued that vacancies would need to fall by 4% over three months to suggest that the economy is contracting, based on the historical relationship with gross value added (GVA). The decline between June and July is beneath the implied monthly threshold of 1.3%.
The chart shows fitted values of a regression of quarterly non-oil GVA growth on the three-month change in vacancies. The latest three-month change (i.e. a decline of 0.9% between April and July) suggests weak GVA expansion.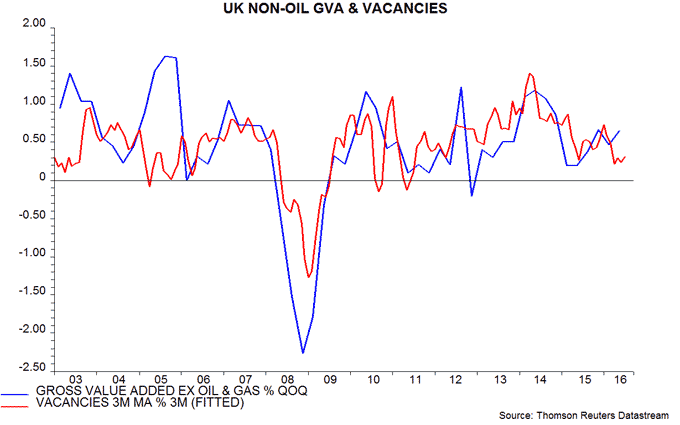
The Office for National Statistics makes available the monthly non-seasonally-adjusted data underlying the reported three-month moving average. This single-month series, adjusted for seasonal factors using the X-12 procedure, fell by 1.0% between June and July – also below the contraction threshold.
The July vacancies number tallies with the Reed job index, a measure of online listings, which edged lower last month but remains close to a May peak – see the previous post for more discussion and a chart. The Reed index is released two weeks before the official vacancies number, with an August reading due in early September.
Claimant-count unemployment, meanwhile, fell by 8,600 in July, the first decline since February, defying expectations of a sizeable rise. This series, while timely, usually lags economic activity and may have been distorted as an indicator recently as claimants have been moved from job-seeker's allowance to universal credit.
The July vacancies number is modestly reassuring but the assessment of the economic outlook here will depend on post-Brexit vote monetary trends, with July data scheduled for release on 30 August.
