Chinese money trends suggesting economic resilience
A softening of Chinese economic activity data in July probably reflects pay-back for strong June results, as well as disruption from high temperatures / drought in parts of the country. Monetary trends suggest that economic growth will remain respectable during the second half.
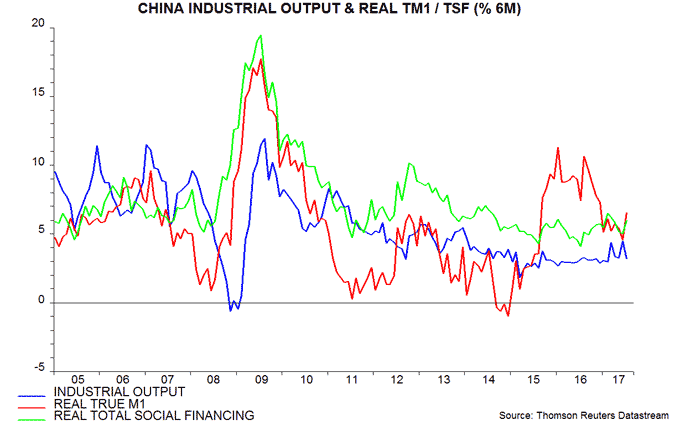
Six-month growth of industrial output* reached a three-year high in June before falling back in July. The July reading, however, was close to the average since 2014 – see first chart.
The preferred monetary aggregate for forecasting purposes here is “true” M1, comprising currency in circulation and demand deposits of corporations and households. (The official M1 measure excludes household deposits.) Six-month growth of real (i.e. consumer price inflation-adjusted) true M1 fell significantly between August 2016 and early 2017, suggesting softer economic momentum from the spring, allowing for an average nine-month lead. Growth, however, has remained above levels associated with economic weakness historically and rebounded in July – first chart.
Credit trends, meanwhile, appear consistent with the official aim of clamping down on speculative lending while maintaining "real economy" funding. Six-month growth of real total social financing of households and non-financial enterprises has fluctuated in a narrow range and was slightly above the average since 2014 in July – first chart. There has, however, been a significant slowdown in bank lending to financial institutions and government.
The rebound in six-month real true M1 growth in July reflected both a recovery in nominal expansion and a sharp decline in six-month consumer price inflation.
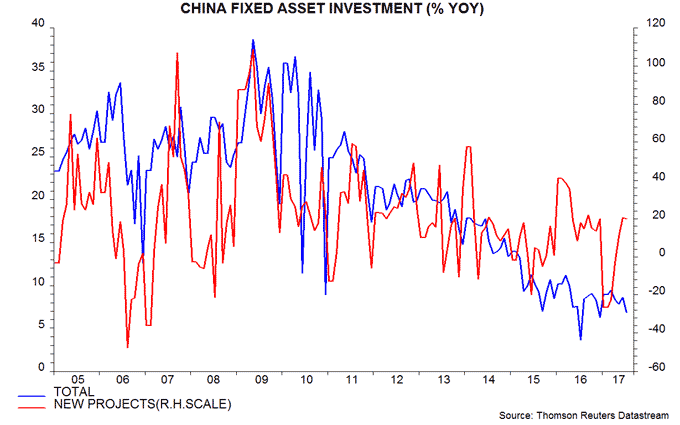
Pessimists argue that first-half policy tightening will exert an increasing drag on the economy during the second half. The rise in money market interest rates, however, has yet to feed through to a significant increase in bank lending rates – second chart. On the fiscal side, the central government deficit has been stable while annual growth in fixed asset investment in newly-started projects rebounded strongly in June / July – third chart.

Money rates have subsided since June, with easing inflation and currency stability giving the PBoC scope to engineer a further decline, if necessary.
A constructive economic view will be maintained here barring a further slowdown in real true M1 growth.
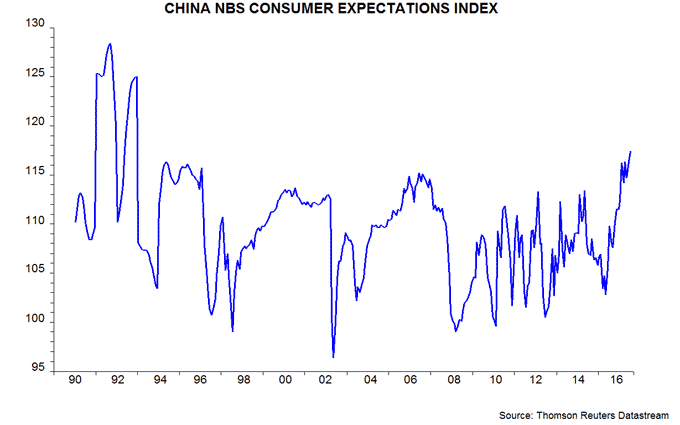
Commentary on China is biased towards negativity, playing down or ignoring positive surprises. A recent rise in the NBS consumer expectations index to its highest level since 1993, for example, has received little attention – fourth chart.
*Seasonally adjusted series sourced from World Bank.

Reader Comments (3)
Your historical argument that real M1 determines growth 6 - 9 months out is under pressure. If we look at the first chart we see real true M1 falling from approximately August 2016 - January 2017, whereupon it drifts down a little more from January - June before rebounding.
The 5 month fall in real true M1 from August 2016 - January 2017 followed by a downwards trend from January - June 2017 would seem to suggest falling GDP growth beginning approximately February - May and ending (assuming the July reading is a positive turning point) December 2017 - March 2018. Yet industrial output has been slightly up in the relevant period so far.
I do note, however, that the 2 peaks in real M1 in approximately December 2015 and June 2016 seem to be replicated in industrial output peaks in approximately February and June 2017 suggesting the relationship has stretched out to a 1 year lag.
If this is the case then it is likely industrial output will lose momentum from August/September this year until January 2018 before trending sideways.
Thanks for your observations.
The rule of thumb is that real money growth leads economic growth by between six and 12 months. The average lead time in a study of G7 data over the last 50+ years was nine months.
The “theory” underlying the rule is that monetary changes are reflected first in economic activity, feeding through to prices much later.
This is usually but not always the case. The surge in Chinese money growth in 2015-16 appears to have had a much larger impact on producer prices than economic activity. Similarly, weaker growth since August 2016 has already been reflected in a sharp slowdown in producer prices.
This suggests using nominal money trends to forecast nominal industrial output, i.e. output volume times producer prices. A post on 21 June showed this relationship. Nominal output growth has fallen significantly from a peak reached in March 2017, consistent with the monetary slowdown from August 2016.
Nominal money growth stabilised between March and June before picking up in July. Nominal output growth, therefore, may bottom out soon and revive in late 2017 / early 2018. Based on recent experience, the revival may be driven by producer prices, with real output growth remaining relatively stable.
Thanks for the reply, so you did explain this phenomenon clearly on 21 June and my tracking system tells me I read it (but forgot it!).
Must do my homework more effectively before commenting and then having to remove my foot from my mouth. On the positive side I'll remember this now and my understanding has been increased, thank you.