
Chinese money trends still strengthening
 Simon Ward
 Post a Comment
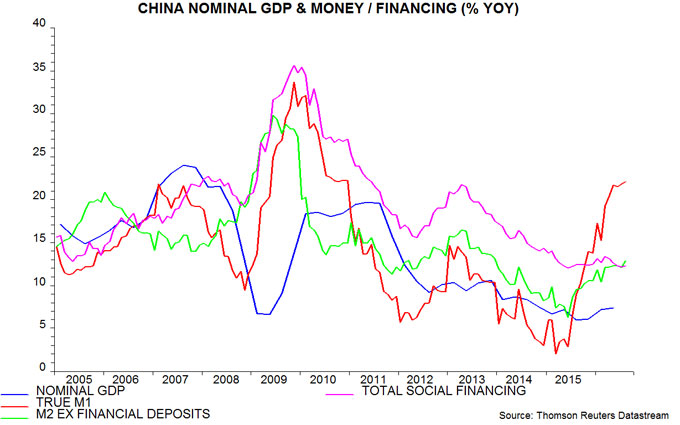
Chinese monetary trends continue to give an unambiguously positive message for near-term economic prospects.
The preferred narrow and broad money measures here are “true” M1 and M2 excluding financial deposits. True M1 includes household demand / temporary deposits, which are omitted from the official M1 aggregate. Financial deposits within M2 are volatile and appear unrelated to current or prospective economic developments.
Annual growth of true M1 rose to 22.1% in August, with M2 ex financial deposits expansion up to 12.8% – the fastest since 2011 and 2013 respectively. The continued upswing signals further nominal GDP acceleration over coming quarters – see first chart.

The second chart shows six-month changes in industrial output and real true M1 / M2 ex financial deposits (i.e. deflated by consumer prices). The real money growth measures had moderated from late 2015 / early 2016 peaks but shot up again in August, reaching new highs – second chart.

Some recent commentary has claimed, bizarrely, that the large gap between narrow and broad money growth is a negative signal for economic prospects. There is no theoretical or empirical basis for this view. Money held in narrow form is more likely to be spent. The gap was last similarly large in 2010 ahead of a sustained period of strong economic growth. G7 evidence confirms that changes in the gap are positively, not negatively, correlated with future growth.
The size of the gap is of much less significance than the fact that both narrow and broad money are accelerating, in both nominal and real terms.
Another claim is that economic recovery has been achieved at the expense of unsustainable credit expansion. Annual growth of total social financing (TSF) of 12.3% in August, however, was barely above a multi-year low of 12.0% reached in June 2015 – third chart. TSF continues to outpace nominal GDP expansion by a wide margin but the gap is likely to narrow. The TSF / GDP ratio will reach a limit at some point but when and at what level are unknowable.
 View Printer Friendly Version
 Email Article to Friend
Reader Comments