
Entries from February 11, 2024 - February 17, 2024
Do monetary trends explain recent inflation divergence?
 Simon Ward
 1 Comment
Six-month core CPI momentum has returned to a target-consistent level in the Eurozone and UK, with January readings of 2.1% and 1.9% annualised respectively*. US momentum is significantly higher, at 3.6% – see chart 1. What explains this gap?
Chart 1
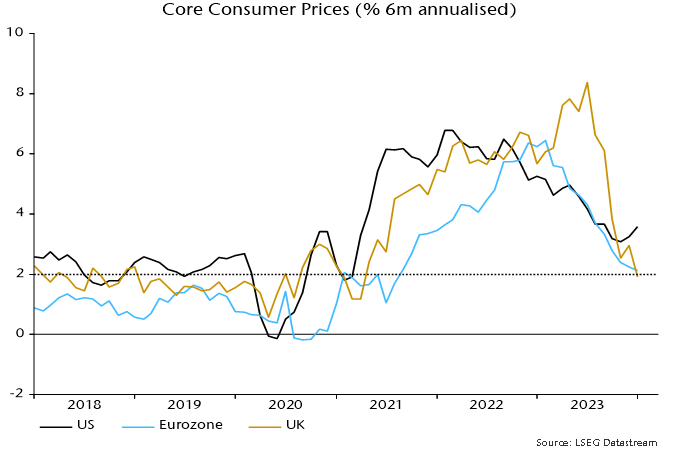
One answer is that the US CPI is overstating core pressure. The six-month increase in the Fed’s preferred core PCE measure was 1.9% annualised in December. Assuming a monthly rise of 0.4% in January (the same as for core CPI), six-month momentum would firm to 2.4% – still little different from Eurozone / UK core CPI readings.
The stronger rise in the US CPI than the PCE index reflects a higher weighting of housing rents and a faster measured increase in “supercore” services prices.
Perhaps reality lies somewhere between the two gauges, i.e. the stickiness of US core CPI momentum is at least partly genuine. If so, the US / European divergence may be explicable by monetary trends in 2021-22.
Previous posts highlighted the close correspondence between the slowdowns in Eurozone and UK six-month CPI momentum and profiles of broad money growth two years earlier. Chart 2 updates the UK comparison to incorporate January CPI data.
Chart 2
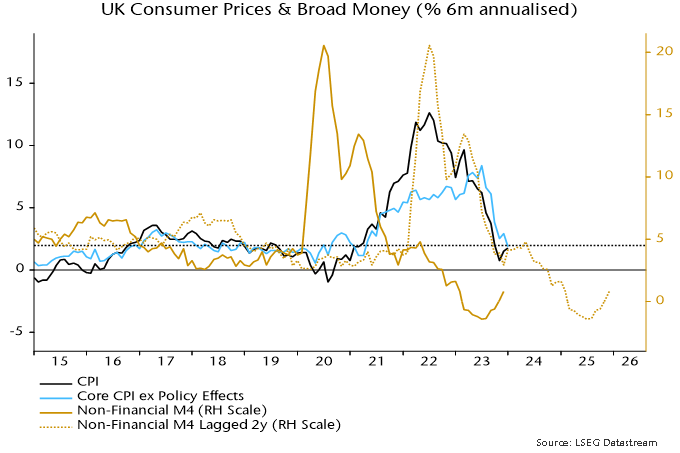
UK and Eurozone six-month broad money momentum peaked in summer 2020 and had returned to the pre-pandemic range by late 2021. This is consistent with the reversion of six-month headline and core CPI momentum to target-consistent levels around end-2023.
US broad money momentum followed a different path, with a more extreme surge in summer 2020, a return to earth in H2 2020 and a secondary rise in H1 2021, driven partly by disbursement of stimulus checks in December 2020 and March 2021 – chart 3.
Chart 3
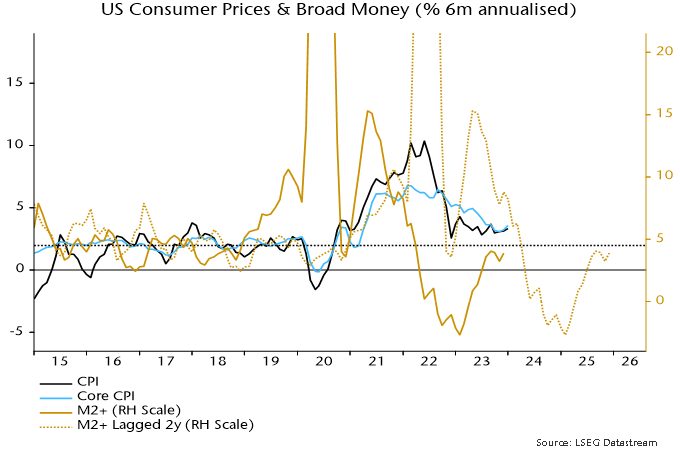
The sharp fall in US six-month money growth during H2 2020 was echoed by a slowdown in CPI momentum into end-2022 – much earlier than occurred in the Eurozone and UK. More recent CPI stickiness may reflect the lagged effects of the secondary monetary acceleration into mid-2021.
What does this suggest for absolute and relative prospects? The judgement here is that broad money growth of 4-5% pa is consistent with 2% inflation over the medium term. US six-month money momentum crossed below both this range and UK / Eurozone momentum in May 2022, reaching an eventual low in February 2023, at a weaker level than (later) lows in the UK / Eurozone.
Assuming a two-year lead, this suggests that US six-month core CPI momentum will move down to 2% around mid-2024 on the way to a larger (though possibly shorter) undershoot than in the UK / Eurozone.
*Eurozone = ECB seasonally adjusted CPI excluding energy and food including alcohol and tobacco. UK = own measure additionally excluding education and incorporating estimated effects of VAT changes, seasonally adjusted.
UK money trends still suggesting downside risk
UK real money contraction warned of 2022 economic stagnation and 2023 recession. Weakness has abated but real money measures have yet to resume expansion, casting doubt on hopes of a sustainable economic recovery.
The latest ONS numbers are consistent with a recession having started in Q2 2023. Among key features of the GDP release:
-
Gross value added (GVA) at basic prices peaked in Q1 2023, falling by 0.03% in Q2, 0.16% in Q3 and 0.34% in Q4.
-
The cumulative decline in GVA / GDP of 0.5% between Q2 and Q4 is inconsistent with a description of the economy as “flatlining”.
-
Similarly, claims that the consumer has been holding up are no longer tenable given a 1.0% cumulative contraction in household consumption between Q2 and Q4.
-
GDP / GVA fell by 0.2% and 0.3% respectively in the year to Q4, meeting a stronger recession definition than the two-quarter rule (in contrast to Japanese GDP also released today).
-
Nominal as well as real GDP fell in Q4, with the GDP deflator rising at a 2.0% annualised pace between Q2 and Q4.
The suggestion of cyclical peak in Q1 2023 is supported by the LFS employment measure, which reached a high in the three-month period centred on March. (The LFS aggregate is 10% larger than the PAYE employment series, reflecting coverage of self-employment.) Aggregate hours worked also peaked then, falling 1.5% through November.
Real money measures began to contract in H2 2021. GDP stagnated from Q2 2022, consistent with the usual lag. The six-month rates of decline of real narrow and broad money reached a peak in March 2023, warning of H2 economic contraction – see chart 1.
Chart 1
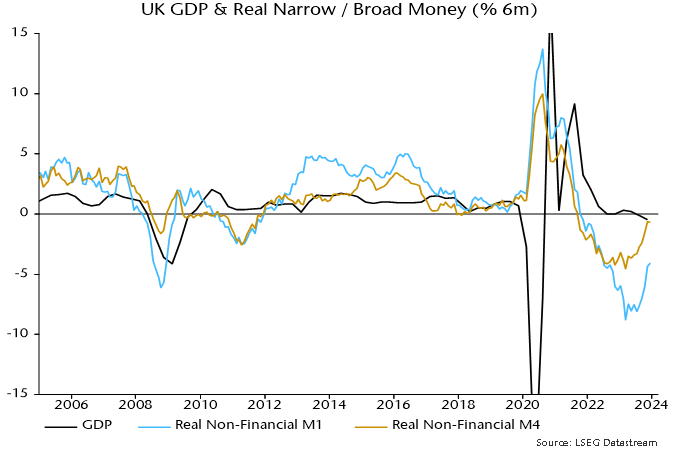
Six-month real money momentum has recovered significantly but has yet to turn positive. Slowing inflation has been a key driver, while nominal broad money is no longer contracting. Economic weakness may abate in H1 2024 but current monetary trends appear inconsistent with a meaningful recovery. Early rate cuts are urgently required to limit still-significant downside risk and head off an extended inflation undershoot.
