Entries from October 29, 2023 - November 4, 2023
Puzzling Chinese money market developments
 Simon Ward
 1 Comment
The PBoC has, ostensibly, been easing monetary policy – it reduced official rates in August, cut reserve requirements in September and has been injecting large sums in its regular lending operations. Yet three-month SHIBOR has risen since late August and is almost back to its March high – see chart 1. What’s going on?
Chart 1
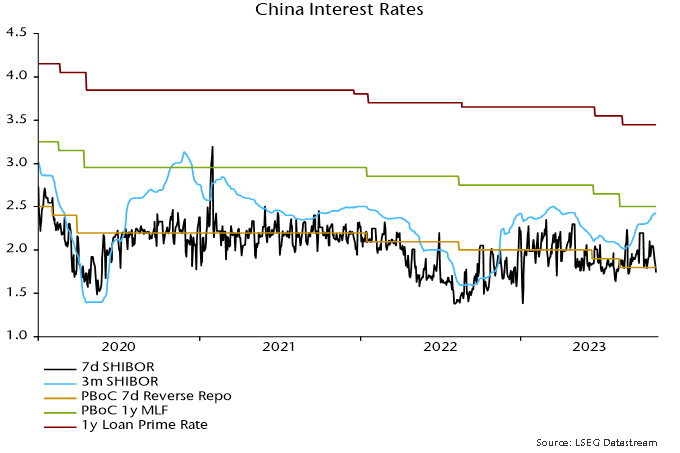
The rise in rates indicates that money market conditions have tightened despite the PBoC’s actions. This could reflect 1) other contractionary influences on bank reserves that have offset the PBoC’s expansionary measures and / or 2) increased reluctance of banks with excess reserves to lend to liquidity-short market participants, i.e. a reduced velocity of circulation of reserves.
Explanation 1) appears to be at least part of the story. The latest published PBoC balance sheet is for end-September. The PBoC expanded its lending to banks by CNY1.47 trillion between end-June and end-September but bank reserves fell by CNY550 billion over this period – chart 2.
Chart 2
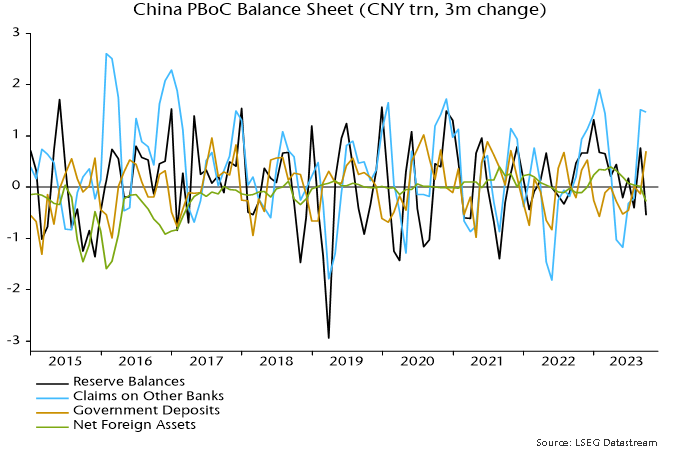
The PBoC’s injections were offset by:
-
A rise in currency in circulation of CNY420 billion (i.e. banks swapped reserves of this value for currency on behalf of their customers).
-
A CNY930 billion increase in government deposits at the PBoC (i.e. there was “overfunding” of the budget deficit over the period, resulting in a transfer from bank reserves).
-
A fall of CNY270 billion in the PBoC’s net foreign assets, consistent with foreign exchange intervention to support the currency (i.e. the PBoC sold dollars etc., with transactions settled by a transfer from bank reserves).
-
Other unspecified movements within the “other assets” and “other liabilities” categories, which reduced net assets by a further CNY680 billion.
The PBoC has expanded its lending to banks further since end-September, judging from data on reverse repo transactions and lending via its standing and medium-term facilities, but three-month SHIBOR has continued to firm.
It should be emphasised that the PBoC has ultimate control over short-term interest rates because there is no theoretical or practical limit to its ability to supply additional reserves.
Why has it chosen to undersupply market demand for liquidity? A plausible explanation is that officials are concerned that even larger injections would increase downward pressure on the currency.
Foreign exchange reserves fell by $78 billion during Q3 but this overstates PBoC intervention because of valuation effects (stronger dollar, weaker Treasuries). Banks purchased a net $39 billion of foreign exchange over the three months, which is a better guide to official sales and tallies with the fall in net foreign assets on the PBoC’s balance sheet (CNY270 billion = $37 billion at a Q3 average exchange rate of 7.25).
The forward premium or discount on the offshore yuan is an indirect measure of pressure on the currency. The discount widened in October, which may indicate that intervention had to be stepped up – chart 3.
Chart 3
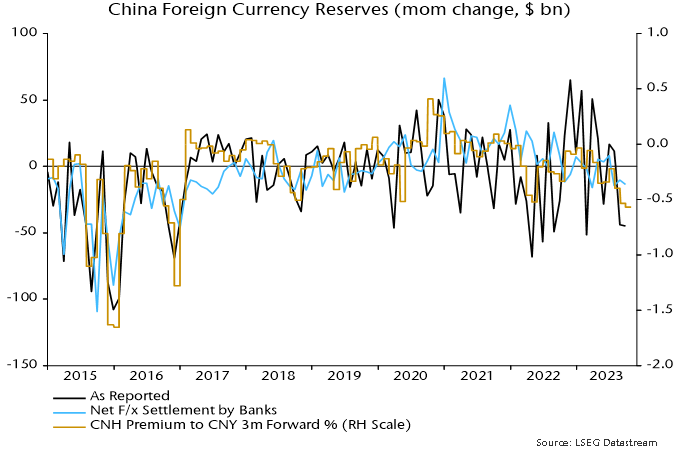
The reserves outflow is much less than before / after the 2015 devaluation, when monthly intervention appears to have peaked at over $100 billion.
The rise in money rates is worrying for monetary prospects. Six-month narrow money growth slowed sharply over the summer, a movement judged here to reflect an increase in rates in late 2022 / early 2023 caused by the PBoC withdrawing liquidity on concern about a reopening boost to inflation.
Rates fell back between March and August, warranting hopes of a rebound in money growth later in 2023. That prospect has been pushed back and could be cancelled unless rates swiftly reverse the recent rise.
Addendum: Another puzzle is that the PBoC has yet to release the results of its Q3 surveys of enterprises, urban depositors and banks, which should have appeared weeks ago based on the historical schedule. The surveys provide important information, e.g. export orders from the enterprise survey is one of the six components of the OECD’s Chinese leading indicator.
Global real money momentum at new low on BRIC weakness
Additional monetary information confirms an earlier estimate here that global (i.e. G7 plus E7) six-month real narrow money momentum reached a new low in September, extending a decline from a local peak in December 2022 and suggesting further economic deceleration through spring 2024.
The September decline reflects a further fall in E7 momentum, which offset a small G7 recovery and reduced the E7-G7 gap to its narrowest since August 2022 – see chart 1.
Chart 1
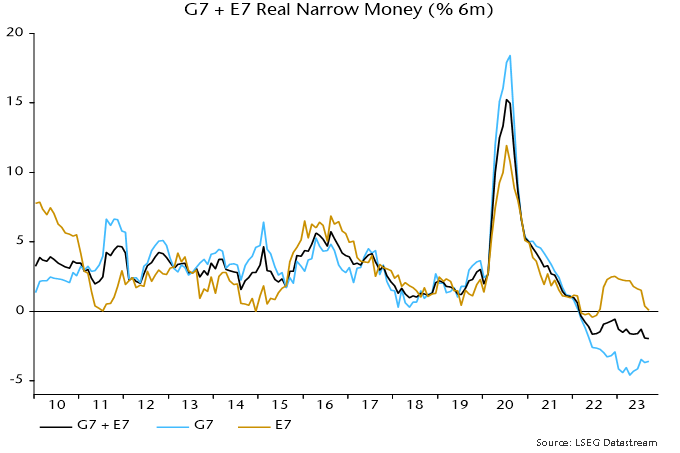
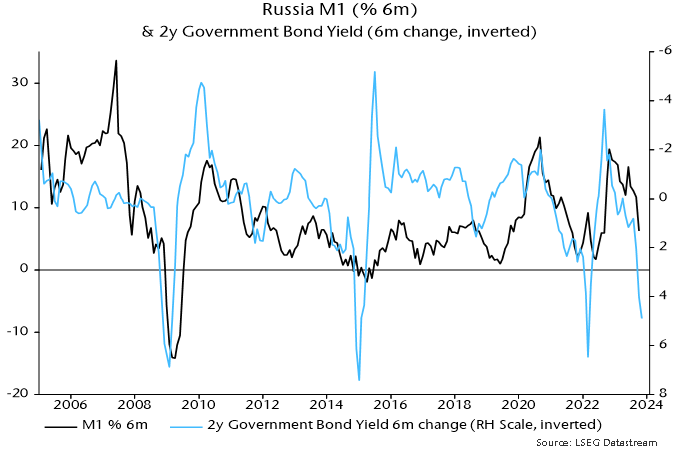
E7 and G7 gauges have moved in opposite directions since April. The E7 decline over May-August was driven by China, India and Brazil, with the September fall due to a plunge in Russia – chart 2. Russian weakness is likely to intensify given a recent surge in rates – chart 3.
Chart 2
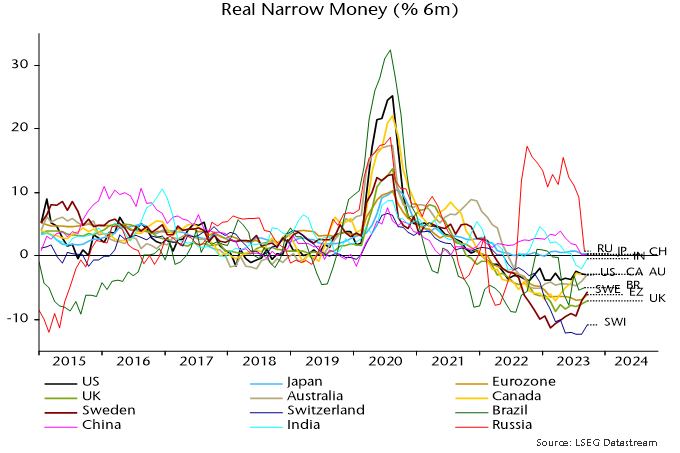
Chart 3
The G7 recovery since April has been due to a minor reduction in the pace of nominal narrow money contraction coupled with a further slowdown in six-month consumer price inflation. The change of direction has occurred in most DM economies and momentum remains weaker in the Eurozone / UK than the US, Canada and Australia – chart 2. Still-extreme negative readings argue against much diminution of recessionary prospects.
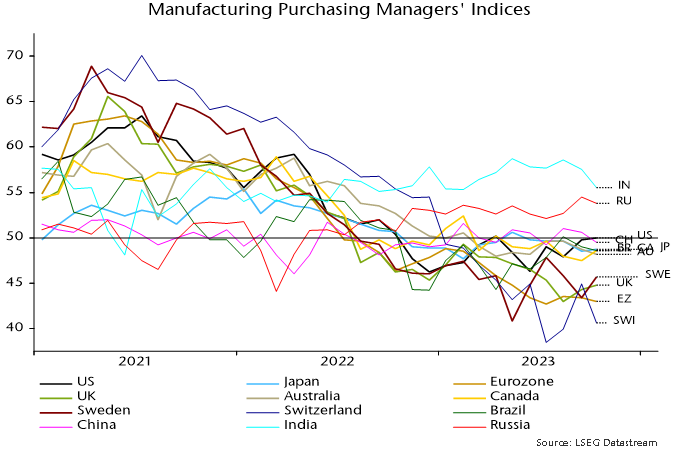
Cross-country S&P Global manufacturing PMI results are broadly consistent with the real narrow money momentum ranking – chart 4 (rank correlation coefficient of latest data points in charts 2 and 4 = 0.85). October PMI falls in India, China, Brazil and particularly Russia may extend given weaker monetary readings. A recent recovery in the US PMI, meanwhile, appears out of line with negative / little changed real money momentum and could reverse (as did the ISM manufacturing PMI last month).
Chart 4
UK M4ex distorted but money trends still alarming
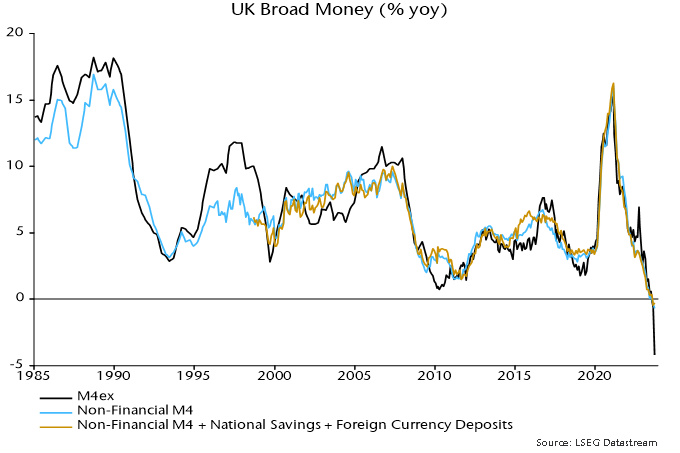
UK money trends are recessionary / deflationary but not as disastrous as suggested by the Bank of England’s M4ex broad money measure, which plunged 4.2% in the year to September after a 0.6% annual decline in August.
M4ex includes money holdings of non-bank financial corporations (excluding intermediaries such as central clearing counterparties, hence M4ex). These holdings surged in September 2022 as LDI funds scrambled to raise cash to meet collateral requirements, creating an unfavourable base effect for the annual M4ex change in September 2023.
The long-standing practice here has been to focus on non-financial monetary aggregates, where available, because movements in financial sector money holdings can be erratic and usually have little bearing on near-term economic prospects.
Non-financial M4, encompassing money holdings of households and private non-financial businesses, fell by 0.1% between August and September for an annual decline of 0.7% compared with 0.3% the previous month – see chart 1.
Chart 1
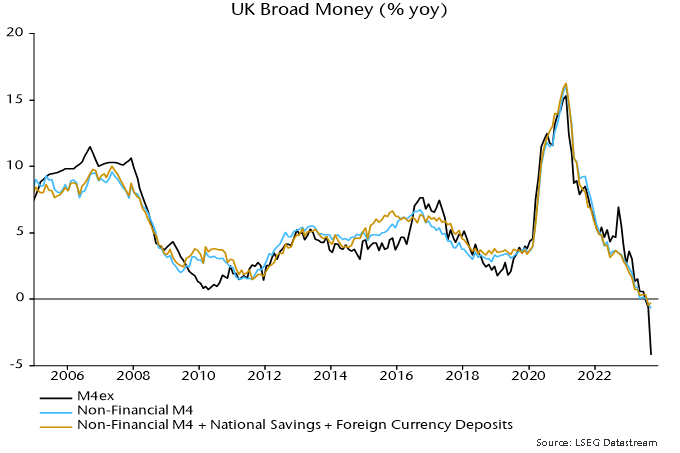
The monthly movements in M4ex and non-financial M4 in September were depressed by savers shifting funds out of bank deposits into high-yielding National Savings growth bonds (now withdrawn). The impact of National Savings flows on annual changes has been minor, however: an expanded non-financial measure including National Savings and foreign currency deposits fell by 0.3% in the year to September – chart 1.
The LDI crisis distortion to the annual M4ex change will unwind in October / November – money holdings of non-bank financial corporations declined by £51 billion in October / November 2022 after a £65 billion jump in September.