
Entries from July 23, 2023 - July 29, 2023
Why investors should fade a possible ISM bounce
 Simon Ward
 1 Comment
A bottoming out of the global stockbuilding cycle could be associated with a near-term recovery in manufacturing survey indicators. Money trends suggest that any revival will be modest / temporary and offset by wider economic weakness.
Economic news has been unusually mixed since end-2021, with GDP weakness contrasting with labour market strength and manufacturing deterioration offset by services resilience. Confusing signals have contributed to market hopes of a “soft landing”.
Sectoral and regional divergences may persist in H2 2023. The expectation here is that manufacturing survey weakness will abate but labour market data will worsen significantly. Money trends continue to cast strong doubt on soft landing hopes. Europe is likely to underperform the US.
The US ISM manufacturing new orders index – a widely watched indicator of industrial momentum – hit a low of 42.5 in January and retested this level in May before recovering to 45.6 in June.
Reasons for expecting a further rise include:
-
The index has been in the 40s since September 2022 and the mean duration of sub-50 periods historically was eight months (ignoring episodes of three months or less).
-
The global stockbuilding cycle remains on track to bottom out during H2 2023 and lows historically were usually preceded by a recovery in US / global manufacturing new orders.
-
Recent price falls for raw materials and other production inputs may further incentivise firms to step up purchasing to maintain or replenish inventories.
Korean manufacturing is a bellwether of US / global trends and the latest Federation of Korean Industries survey reported a marked improvement in optimism, consistent with ISM new orders moving back above 50 – see chart 1.
Chart 1
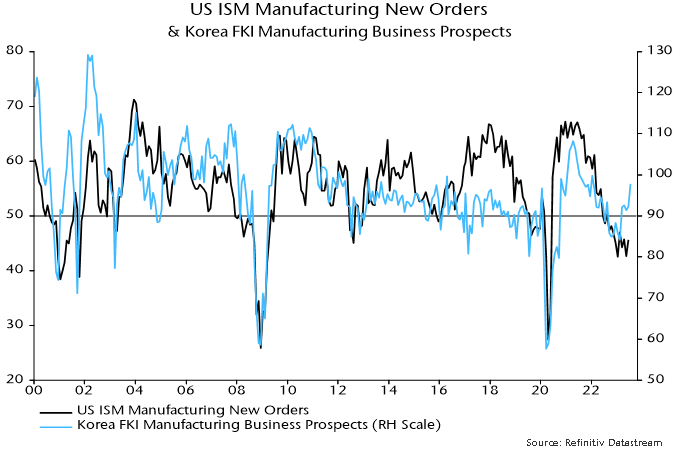
Sustained recoveries in ISM new orders from the mid 40s into expansionary territory historically occurred against a backdrop of positive and / or rising six-month real narrow money* momentum. Current trends are unfavourable, with momentum still significantly negative and moving sideways – chart 2.
Chart 2
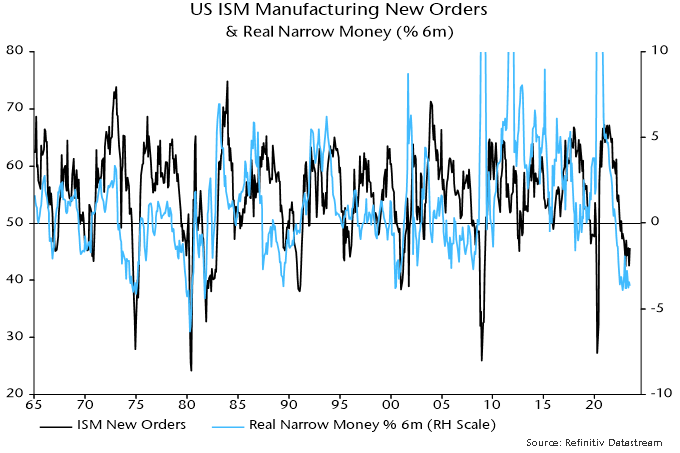
Examples of recoveries to above 50 without a supportive monetary backdrop include 1970 and 1989-90. In both cases the rise was modest (peaking below 55), short-lived and followed by a decline to a lower low. The recovery in 1970 occurred within an NBER-defined recession and in 1989-90 just before one.
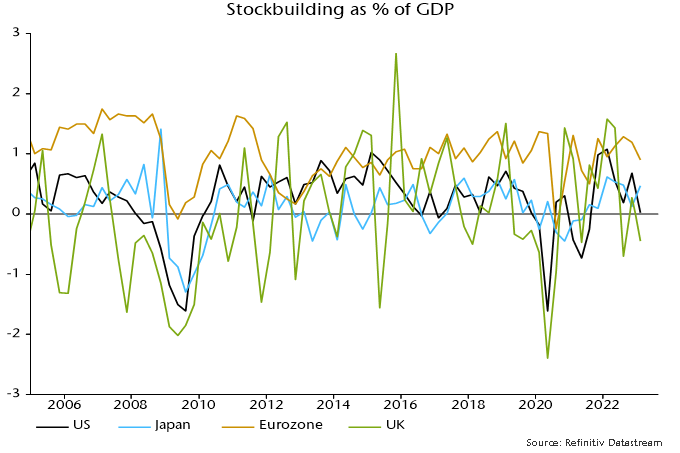
An ISM rebound might not be mirrored by much if any revival in European manufacturing surveys. Money trends are even weaker than in the US, while the stockbuilding adjustment started later in the Eurozone and probably has further to run – charts 3 and 4.
Chart 3
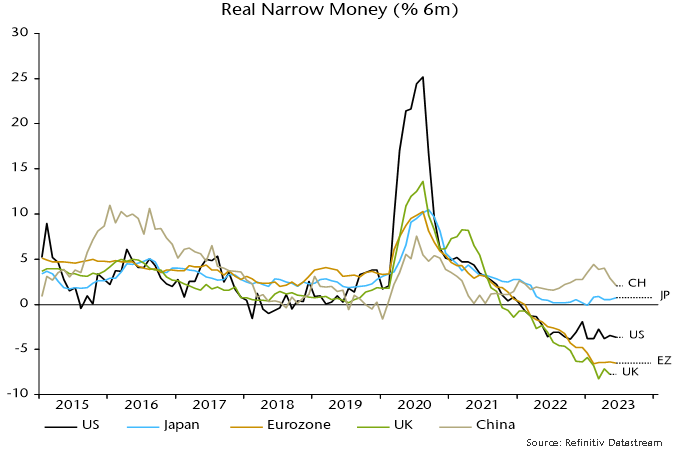
Chart 4
*Narrow money definition used here = M1A = currency + demand deposits.
Why UK inflation underperformance could be ending
UK headline CPI momentum continues to track a simplistic “monetarist” forecast based on the profile of broad money momentum two years earlier.
Six-month growth of headline prices, seasonally adjusted, peaked at 12.7% annualised in July 2022 and had halved to 6.5% as of June. This mirrors a halving of six-month broad money momentum from a peak of 20.5% annualised in July 2020 to 10.5% in June 2021 – see chart 1.
Chart 1
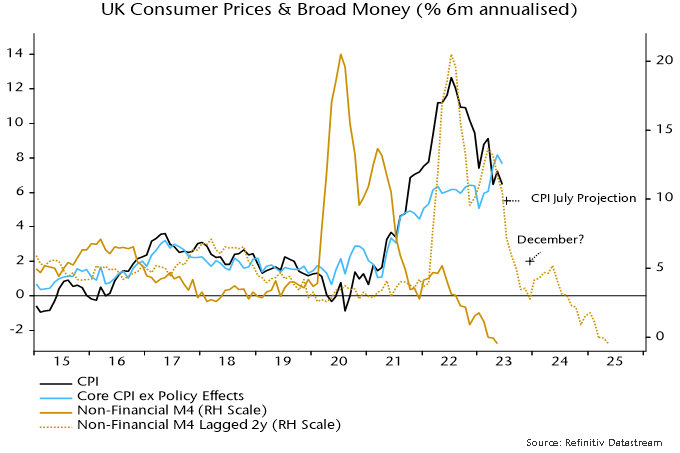
Broad money continued to slow sharply during H2 2021, with six-month momentum down to 2.7% by December, suggesting a fall in six-month CPI momentum to 2% annualised or lower by late 2023 / early 2024.
A 2% rate of increase of prices during H2 2023 could be achieved by the following combination:
The energy price cap falling by a further 10% in October, in line with current estimates based on wholesale prices, following the 17% July reduction.
Food, alcohol and tobacco prices slowing to an 8% annual inflation rate by December from 14.9% in June.
Core prices rising at a 4% seasonally adjusted annualised rate during H2 2023, down from 7.7% in H1.
The latter two possibilities are supported by producer output price developments – annual inflation of food products is already down from a 16.8% peak to 8.7%, while core output prices flatlined during H1, following a 6.4% annualised rise during H2 2022.
A 2% annualised CPI increase during H2 2023 would imply a headline annual rate of about 4% by year-end, well with PM Sunak’s target of a halving from 10%+ levels, although he will have made no contribution to the “success”.
Why has UK CPI inflation exceeded US / Eurozone levels, both recently and cumulatively since end-2019?
The assessment here is that the divergence reflects relatively weak UK supply-side economic performance and a larger negative terms of trade effect, rather than more egregious monetary excess.
Charts 2 and 3 show that UK / Eurozone broad money expansion since end-2019 has been similar and less than in the US, with the relative movements mirrored in nominal GDP outcomes.
Chart 2
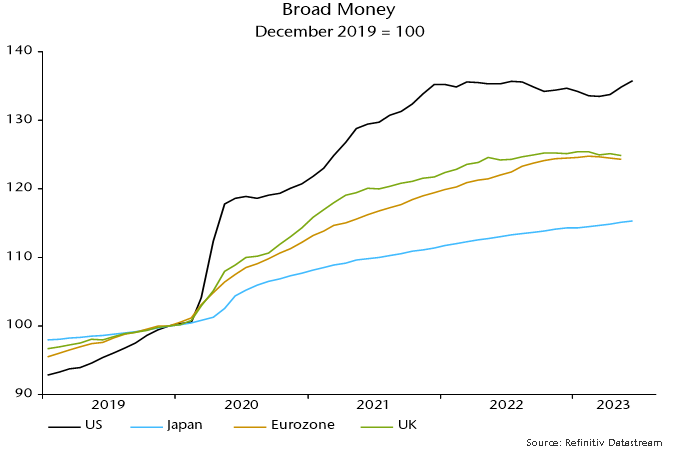
Chart 3
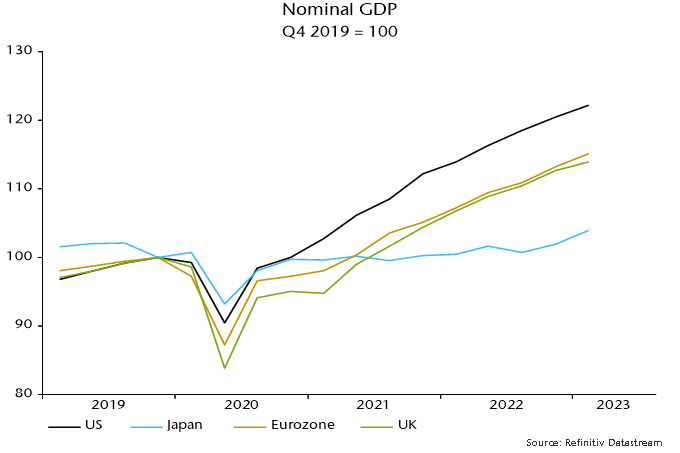
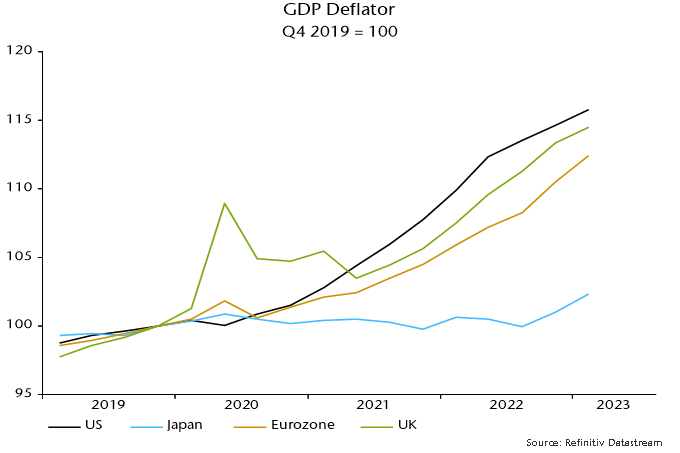
The UK has, however, underperformed the US and Eurozone in terms of the division of nominal GDP expansion between real GDP and domestically-generated inflation, as measured by the GDP deflator – charts 4 and 5.
Chart 4
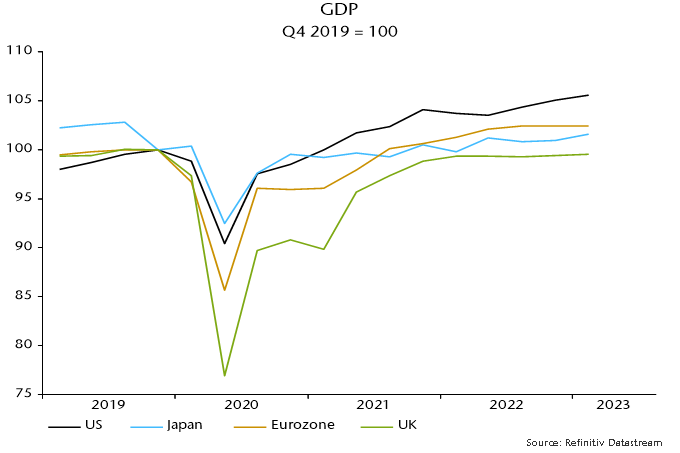
Chart 5
UK consumer prices were additionally boosted relative to the US by opposite movements in the terms of trade (i.e. the ratio of export to import prices), reflecting different exposures to energy prices as well as currency movements (i.e. a strong dollar through last autumn) – chart 6.
Chart 6
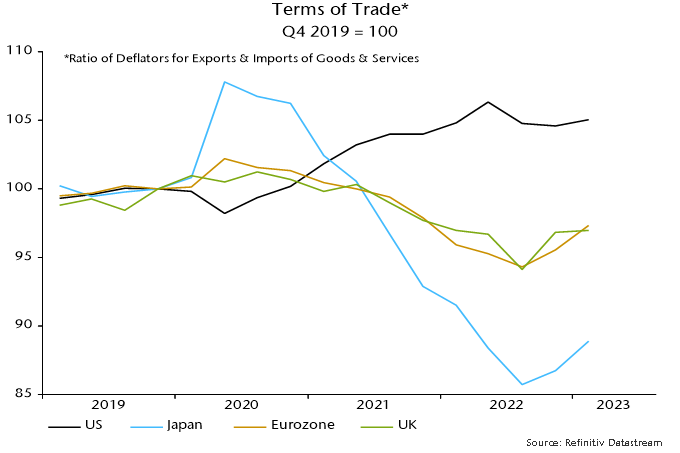
UK supply-side weakness may be structural but monetary and terms of trade considerations suggest an improvement in UK relative inflation performance – annual broad money growth is now similar to the US and below the Eurozone level, while sterling appreciation since late 2022 may extend a recent recovery in the terms of trade.
