
Entries from June 25, 2023 - July 1, 2023
UK recession gauge in red zone before Q2 rate hikes
 Simon Ward
 1 Comment
A recession likelihood gauge placing weight on monetary variables indicates a high probability of a contraction in UK GDP / gross value added (GVA) over the remainder of 2023.
The indicator, regularly referenced in posts here, is based on a model that generates projections for the four-quarter change in GVA three quarters in advance using current and lagged values of a range of monetary and financial inputs.
Using data up to June 2022, the model assigned a 70% probability to the four-quarter change in GVA being negative in Q1 2023. The current ONS estimate of this change is +0.2%.

The probability reading rises to 96% incorporating data through March 2023, i.e. there is a 96% likelihood of the four-quarter change in GVA in Q4 2023 being negative, according to the model.
The statistical analysis underlying the model indicates that GDP prospects are significantly influenced by movements in real narrow money (non-financial M1) and real corporate broad money (M4). Six-month rates of change of these measures have moved deeper into negative territory since mid-2022.
The model’s increased pessimism also reflects a deepening inversion of the yield curve and falling real house prices. Other inputs include credit spreads and local share prices, which have yet to display recession-scale weakness.
PMIs weaken on schedule; earnings next?
DM flash results released last week suggest that the global manufacturing PMI new orders index fell sharply in June, having moved sideways in April and May following a Q1 recovery – see chart 1.
Chart 1
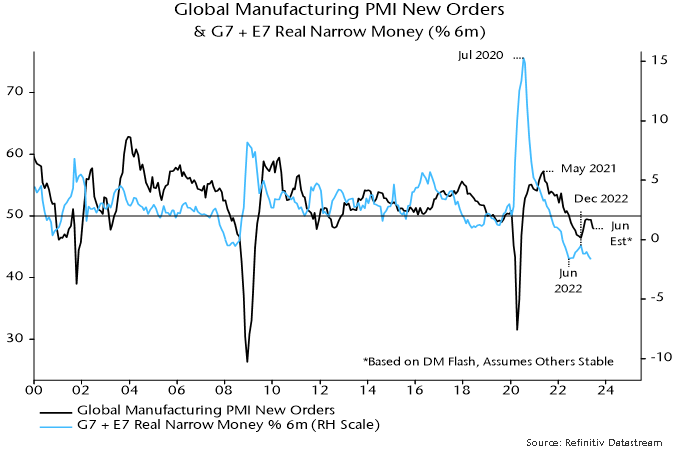
The relapse is consistent with a decline in global six-month real narrow money momentum from a local peak in December 2022. A recovery in real money momentum during H2 2022 had presaged the Q1 PMI revival.
Real narrow money momentum is estimated to have fallen again in May, based on partial data, suggesting further PMI weakness into late 2023.
The global earnings revisions ratio has been contemporaneously correlated with manufacturing PMI new orders historically but remained at an above-average level in June, widening a recent divergence – chart 2.
Chart 2
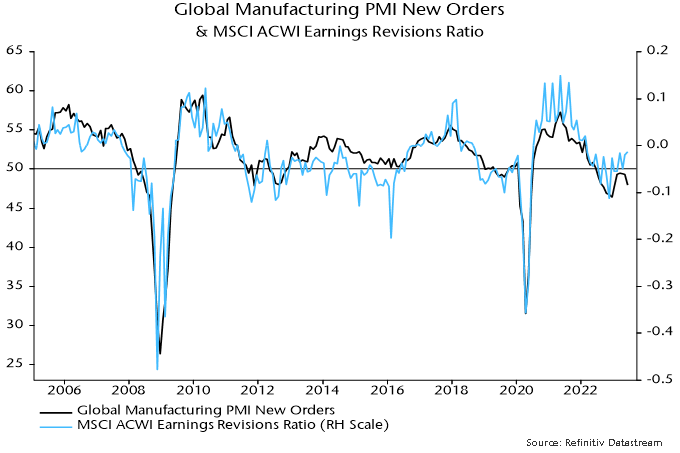
Based on monetary trends, a reconvergence is more likely to occur via weaker earnings revisions than a PMI rebound.
Charts 3 and 4 show that revisions resilience has been driven by cyclical sectors – in particular, IT, industrials and consumer discretionary. Notable weakness has been confined to the materials sector. Cyclical sectors may be at greater risk of downgrades if the global revisions ratio heads south.
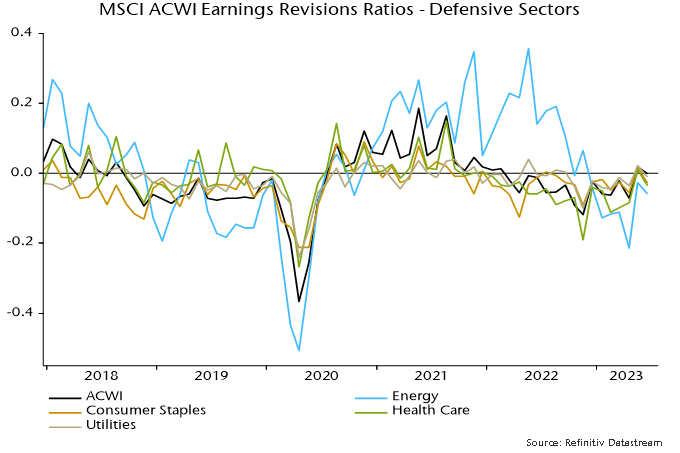
Defensive sector revisions have underperformed recently but are likely to be less sensitive to economic weakness.
Chart 3
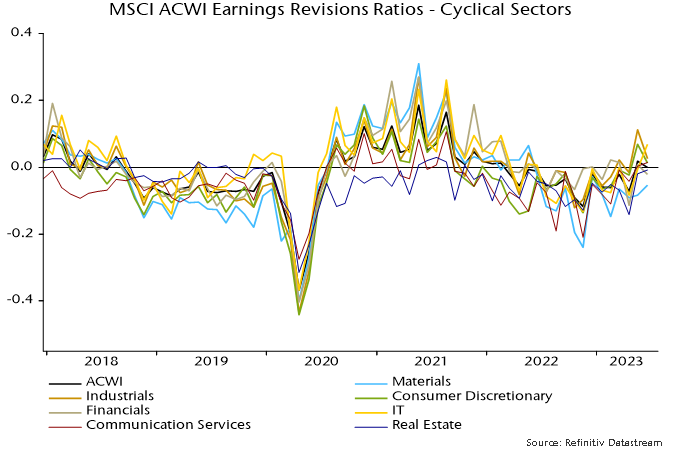
Chart 4
The positive divergence of earnings revisions from the PMI may reflect firms’ ability to push through price increases to compensate for slower volumes. The deviation of the global revisions ratio (rescaled) from manufacturing PMI new orders – i.e. the gap between the blue and black lines in chart 2 – has displayed a weak positive correlation with the PMI output price index historically (contemporaneous correlation coefficient = +0.41).
Any earnings support from pricing gains is now going into reverse: the output price index has crashed from an April 2022 peak of 63.8 to 49.8 in May, with DM flash results suggesting a further fall last month.
