Entries from May 7, 2023 - May 13, 2023
Recession warning from UK vacancies
 Simon Ward
 1 Comment
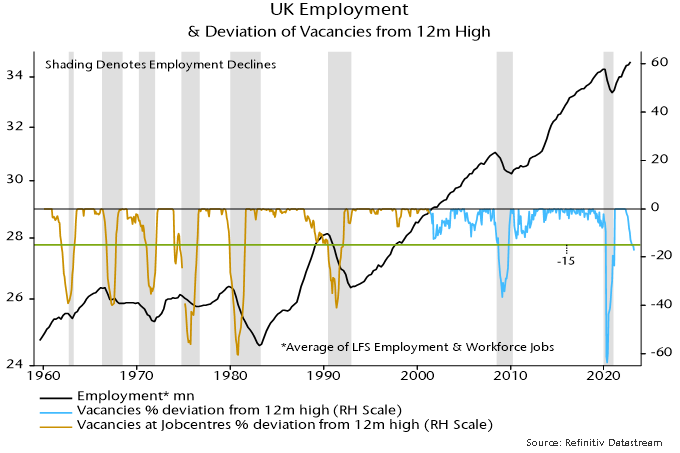
UK vacancies – like US job openings – are signalling an employment recession.
A previous post noted that a fall in US job openings of more than 15% from a rolling 12-month high was always (since the 1950s) associated with a multi-month fall in payrolls. The 15% threshold was crossed in February data released last month, with the shortfall increasing to 18% in March.
It turns out that the 15% rule also works in the UK, correctly signalling all eight employment recessions since the 1960s with no false warnings. Recent developments mirror the US: the decline in vacancies from peak crossed 15% in January, rising to 17% in March.
The official vacancies series, based on a survey of employers, starts in 2001. Earlier numbers are available (back to 1960) for vacancies notified to Jobcentres. When the latter series was replaced in 2001, Jobcentre vacancies accounted for about 60% of the total. The analysis here combines the two series, effectively assuming that Jobcentre vacancies were a constant proportion of the total before 2001.
Employment recessions were defined as multi-quarter declines in an average of two series – total employment (from the Labour Force Survey of households) and workforce jobs (based mainly on a survey of employers). The latter series – like US non-farm payrolls – counts positions rather than workers and is about 10% larger, reflecting multiple job holding.
As in the US, the 15% threshold was usually reached around the time that employment started to decline, although this may not have been immediately apparent because of reporting lags and revisions.
A Q1 reading of the total employment series is not yet available but LFS data through February and PAYE employee numbers suggest another rise. Based on the vacancies signal, a sustained decline may begin in Q2.
Capex weakness to drive PMI double dip
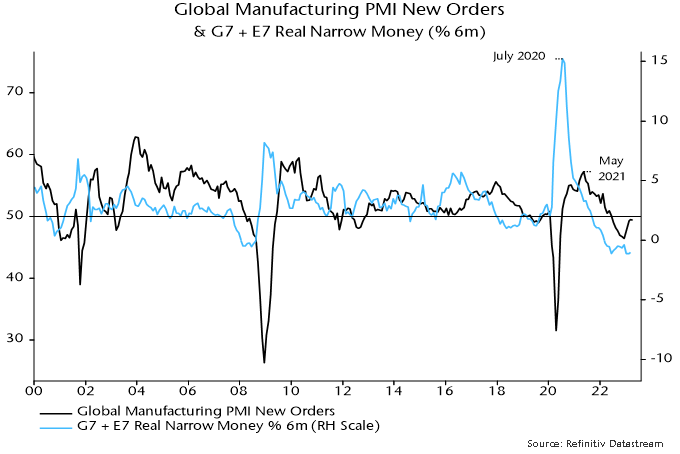
The global manufacturing PMI new orders index – a timely indicator of global goods demand – was little changed below 50 (49.4) in April, a weaker result than had been suggested by DM flash results.
Inventories indices for finished goods and production inputs, meanwhile, rose further to their highest levels since November. Accordingly, new orders / inventories differentials – which often lead at turning points – fell for a second month.
These results are consistent with the forecast here that a recovery in PMI new orders since December 2022 would fizzle out in H1 and reverse into H2, with a possibility of a break below the December low. The basis for the forecast was a relapse in global (i.e. G7 plus E7) six-month real narrow money momentum around end-2022. Real money momentum moved sideways in March at around its June 2022 low – see chart 1.
Chart 1
A downswing in the stockbuilding cycle was a key driver of earlier PMI weakness. A further drag is in prospect but the down phase of the cycle is well advanced, with incoming data and average cycle length suggesting a low during H2.
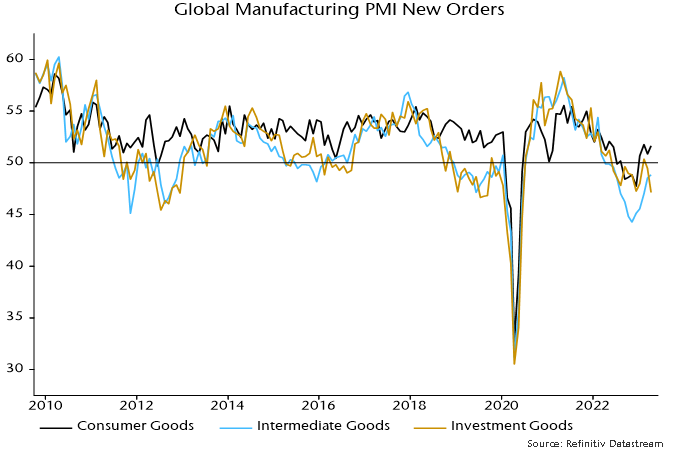
Business capex is emerging as a new source of global goods demand weakness. The capital goods component of PMI new orders reached a new low in April – chart 2.
Chart 2
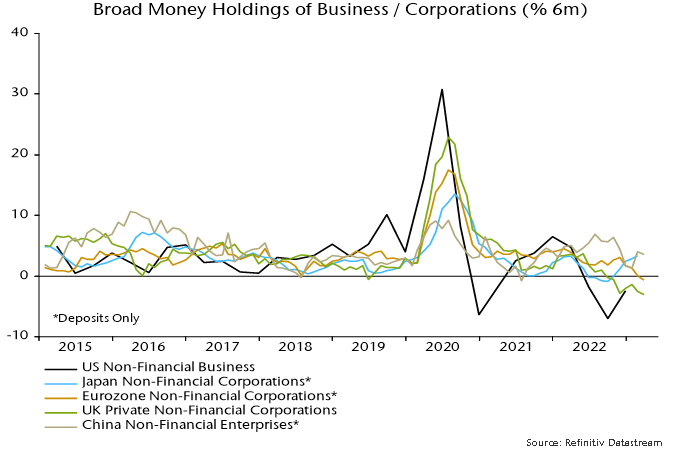
A contraction in business investment is consistent with a squeeze on real profits in late 2022 – chart 3 – and weak corporate money trends: business broad money holdings have fallen in nominal terms recently in the US, Eurozone and UK – chart 4.
Chart 3
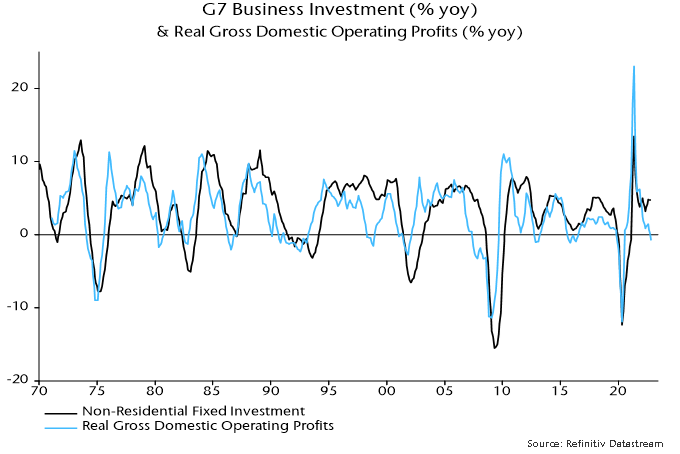
Chart 4
Other evidence of a capex downturn includes:
-
Weak capex intentions in regional Fed manufacturing surveys (and the NFIB small firm survey) – chart 5.
-
Weak enterprise loan demand for fixed investment in the ECB bank lending survey – chart 6.
-
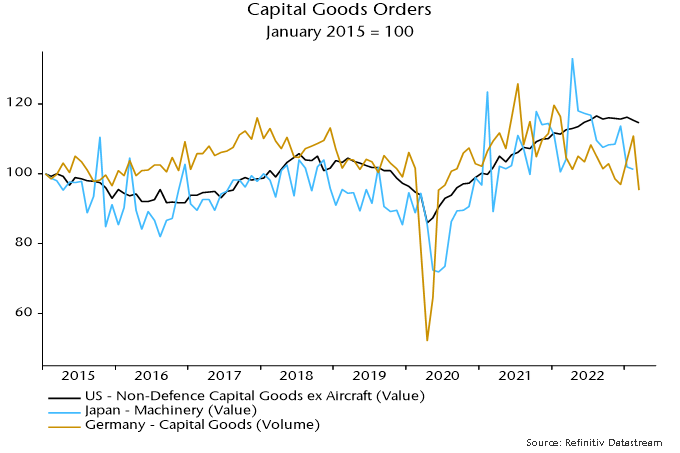
Falling capital goods / machinery orders in the US, Japan and Germany – chart 7.
Chart 5
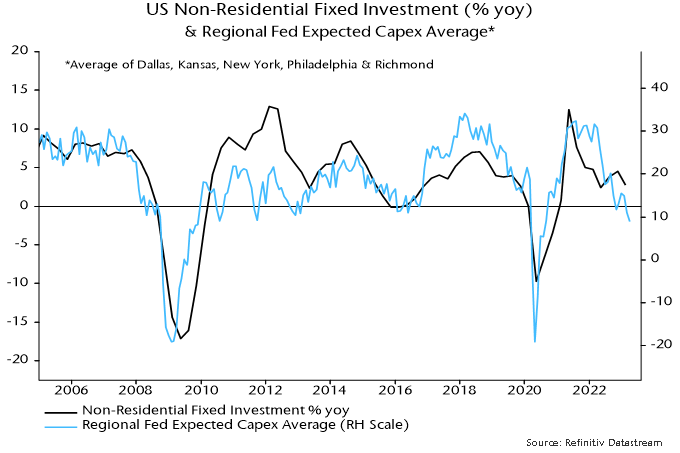
Chart 6
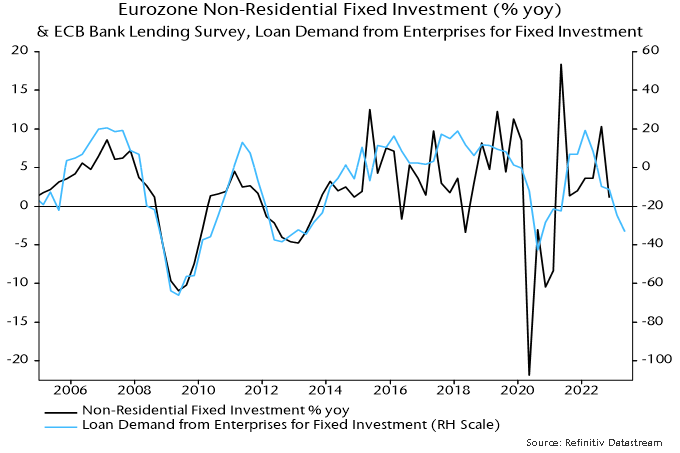 Chart 7
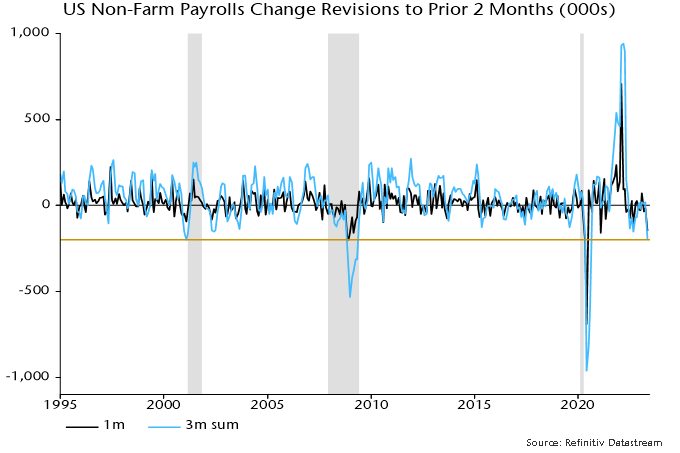
Capex retrenchment is usually accompanied by a fall in labour demand. Adjusted for negative revisions to the prior two months, the addition to US non-farm payrolls in April was 104,000, the smallest since January 2021 – chart 8. Revisions in the last three reports cumulate to -200,000, a level rarely reached outside recessions – chart 9.
Chart 8
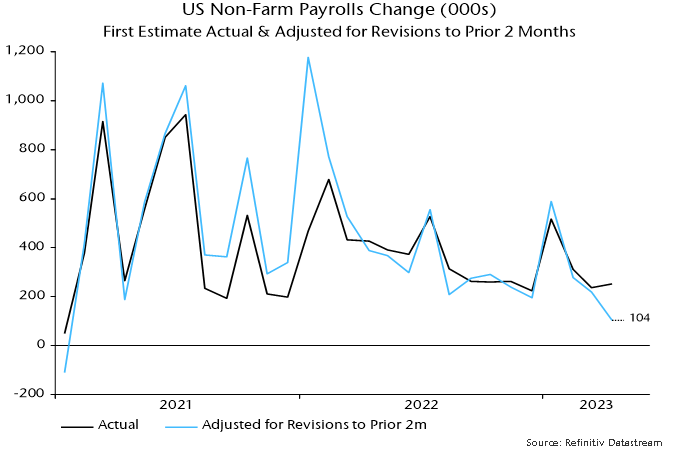
Chart 9