Entries from October 3, 2021 - October 9, 2021
A "monetarist" perspective on current equity markets
 Simon Ward
 Post a Comment
Global industrial output has flatlined since early 2021, reflecting supply disruptions but also a loss of demand momentum. Output may recover into 2022 as supply problems ease but money trends signal a further weakening of underlying momentum. Second-round inflation effects, meanwhile, may force central banks to bring forward plans for stimulus withdrawal – unless markets weaken sharply. This backdrop suggests retaining a cautious investment strategy unless money trends rebound in late 2021 – possible but not a central scenario.
The ”monetarist” forecasting approach used here relies on the rules of thumb that 1) real narrow money growth directionally leads demand / output growth by 6-12 months (average 9 months) and 2) nominal broad money growth directionally leads inflation by 1-3 years (average 2+ years). Global narrow / broad money growth surged in 2020 but has slowed this year. This slowdown is being reflected in a loss of economic momentum but the inflationary impact of the 2020 bulge will continue well into 2022. Current “stagflation” concerns, therefore, are likely to persist.
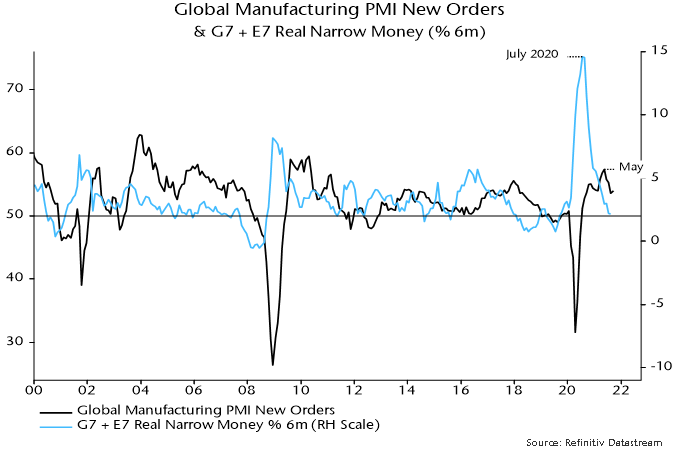
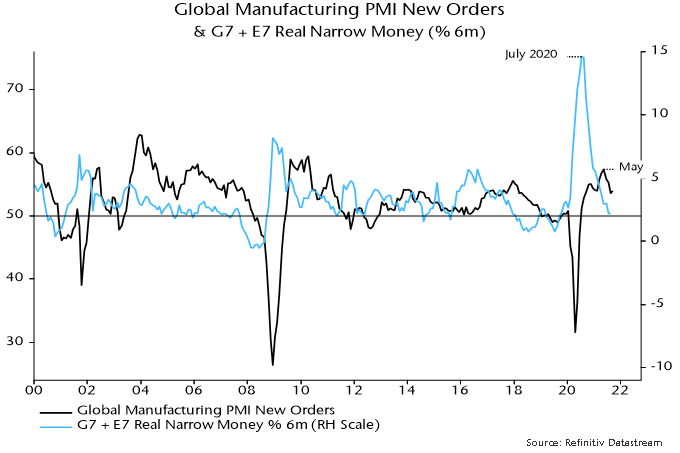
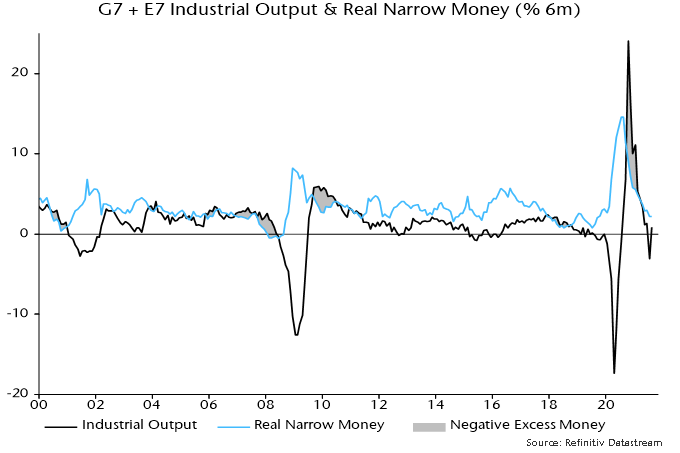
Supply chain disruption is distorting economic data, complicating analysis. The presumption here is that the global manufacturing PMI new orders index is a reasonable guide to underlying industrial demand momentum. The index has fallen since May, mirroring an earlier decline in global (i.e. G7 plus E7) six-month real narrow money growth from a July 2020 peak – see chart 1. With real money growth sliding further into July / August 2021, the suggestion is that the PMI new orders index is unlikely to reach a bottom before early 2022.
Chart 1
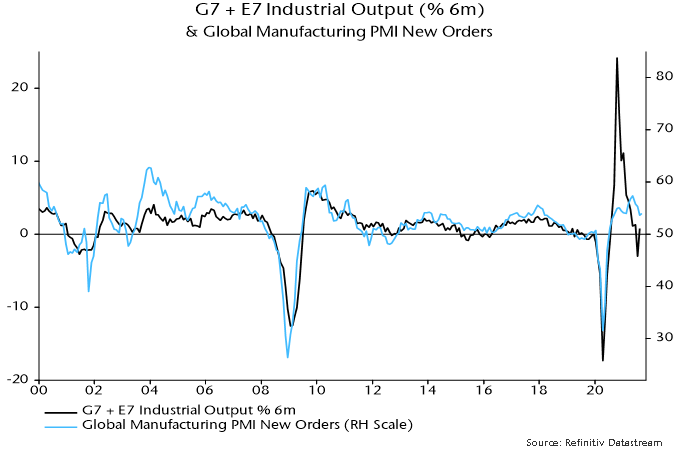
Supply chain disruption, however, has resulted in a substantial undershoot of industrial output relative to the growth rate suggested by the PMI new orders index, implying scope for a short-term catch-up – chart 2. Market participants could wrongly interpret such a pick-up as a reversal in trend momentum. Confusing signals could lead to greater market volatility but any revival in the cyclical / reflation trade is likely to be short-lived unless monetary trends – and hence PMI prospects – improve.
Chart 2
The approach here uses cycle analysis to cross-check monetary signals and provide longer-term context. The 3-5 year stockbuilding and 7-11 year business investment cycles are judged to have bottomed in Q2 2020 and are currently providing a tailwind to the global economy, cushioning the impact of less expansionary monetary conditions.
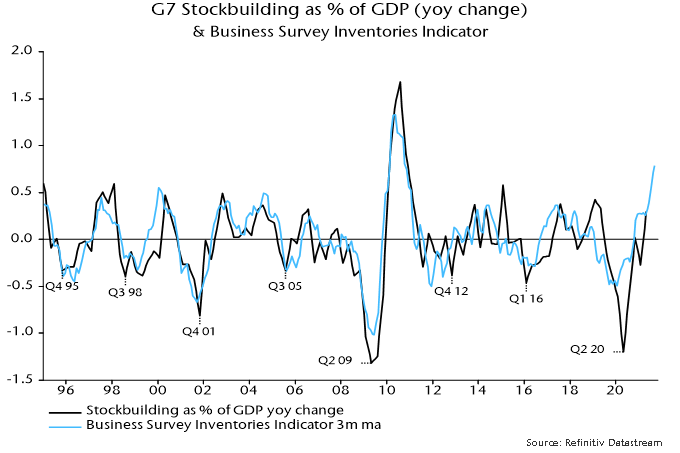
The next cyclical “event” will be a peak and downswing in the stockbuilding cycle. Based on its average historical length of 3 1/3 years, the next cycle low could occur in H2 2023, implying a peak by H2 2022 at the latest. The business survey inventories indicator calculated here, however, suggests that the cycle upswing is already well-advanced, hinting at an early peak – chart 3.
Chart 3
The upshot is that monetary trends suggest a slowdown in global economic momentum through early 2022 while the stockbuilding cycle is likely to act as a drag from H2 2022. This leaves open the possibility of a resumption of strong economic growth in a 2-3 quarter window around mid-2022. An immediate rebound in global real narrow money growth, however, is needed to validate this scenario.
Such a rebound is possible despite the Fed and other central banks moving to wind down stimulus. It could be driven, for example, by Chinese policy easing to support a weak economy, a sharp reversal in commodity prices as industrial momentum softens (boosting real money growth via a near-term inflation slowdown) or a pick-up in bank lending (normal at this stage of stockbuilding / business investment cycle upswings). It is, however, unnecessary to speculate – it is usually sufficient for forecasting purposes to respond to monetary signals rather than try to anticipate them.
Chart 4 shows a breakdown of G7 plus E7 six-month real narrow money growth. Earlier US relative strength / Chinese weakness has been reflected in divergent year-to-date equity market performance, with DM ex. US and EM ex. China indices charting a middle course. A recent cross-over of US real money growth below the G7 ex. US average suggests reducing US exposure in favour of other developed markets.
Chart 4
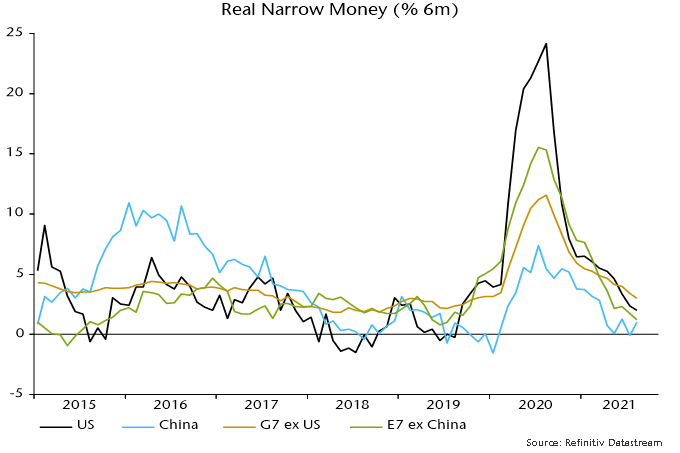
Chinese real money growth, meanwhile, was showing signs of bottoming before the recent escalation of financial difficulties at property developer Evergrande. This could result in faster policy easing, an “endogenous” tightening of credit conditions, or both. The net monetary impact is uncertain but a recovery in money growth in late 2021 would argue for adding Chinese exposure in global and EM portfolios despite likely further weakness in economic data.
Investors continue to debate whether high inflation is “transitory” as central bankers naturally assert. The monetarist view is straightforward: the roughly 2-year transmission of money to prices implies no significant inflation relief before H2 2022, while a return to pre-covid levels requires a further slowdown in global broad money growth.
Inflation drivers are likely to shift, with energy and other industrial commodity prices cooling as the global economy slows but offsetting upward impulses from food, rents and accelerating unit wage costs as labour shortages and mismatches force pay rises above productivity growth.
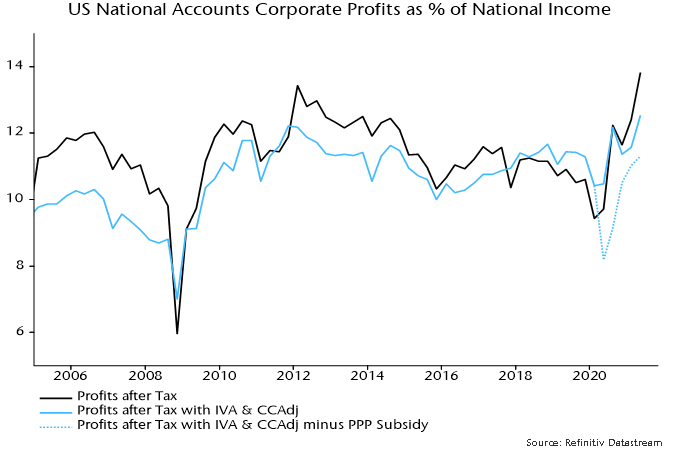
Rising labour costs could, in theory, be absorbed by a reduction in profit margins rather than being passed on in prices. Recent profits numbers, however, overstate underlying health because of stock appreciation and pandemic-related government support. The share in US national income of an “economic” measure of corporate profits (i.e. adjusted for inventory valuation effects and Paycheck Protection Program subsidies, and to reflect “true” depreciation) is in line with its average over 2010-19, in contrast to inflated book profits – chart 5.
Chart 5
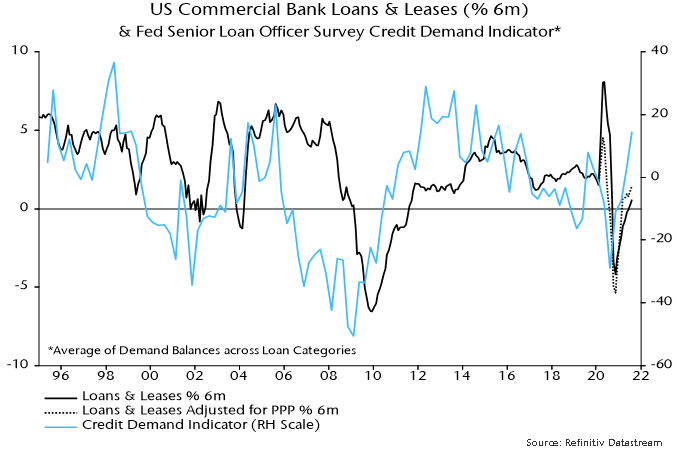
G7 annual broad money growth has fallen from a peak of 17.3% in February 2021 to 8.3% in August, with 3-month annualised growth at 6.2%. This is still high by pre-covid standards: annual growth averaged 4.5% over 2015-19. Reduced support to money growth from QE could be offset by faster expansion of bank balance sheets, reflecting strong capital / liquidity positions and rising credit demand. US commercial bank loans and leases have recently resumed growth, with the Fed’s senior loan officer survey suggesting a further pick-up – chart 6. The ECB’s lending survey is similarly upbeat.
Chart 6
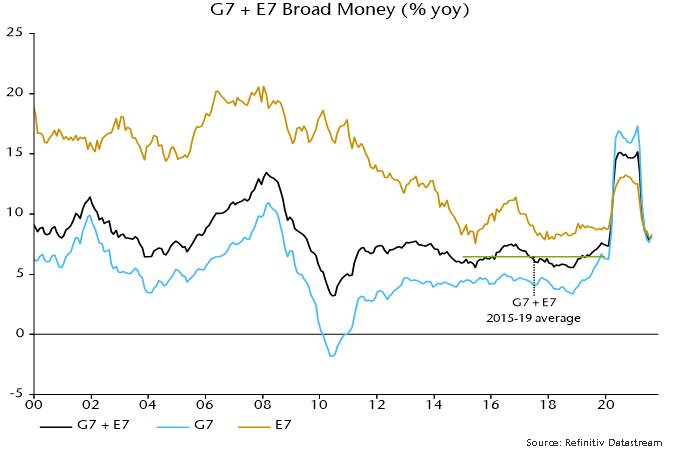
Adding in the E7, annual broad money growth is closer to the pre-covid level, at 8.2% in August versus a 2015-19 average of 6.4% – chart 7. Growth is below average in China, Mexico and Russia and in line in India. Inflationary pressures are more likely to prove “transitory” in these economies, suggesting support for local bond markets.
Chart 7
Global equities held up over the summer despite weaker activity news and upside inflation surprises. A monetarist explanation is that markets were supported by “excess” money, as supply disruptions contributed to global six-month industrial output growth falling below real narrow money growth – chart 8. A temporary output catch-up as supply problems ease could reverse this crossover – a further argument for maintaining a cautious investment stance emphasising defensive sectors and quality.
Chart 8
Fade the PMI bounce
The global manufacturing PMI new orders index – a timely indicator of industrial momentum – registered a surprise small rise in September, with weaker results for major developed economies foreshadowed in earlier flash surveys offset by recoveries in China and a number of other emerging markets.
Does this signify an end to the recent slowdown phase, evidenced by a fall in PMI new orders between May and August? The assessment here is that the rise should be discounted for several reasons.
First, it was minor relative to the August drop. The September reading was below the range over October 2020-July 2021.
Secondly, the increase appears to have been driven by inventory rebuilding. The new orders / finished goods inventories differential, which sometimes leads new orders, fell again – see chart 1.
Chart 1
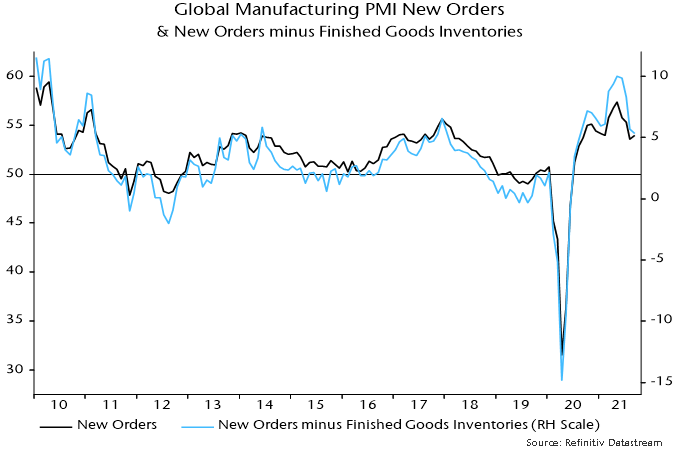
Remember that orders growth is related to the second derivative of inventories (i.e. the rate of change of the rate of change). Inventories are still low and will be rebuilt further but the pace of increase – and growth impact – may already have peaked.
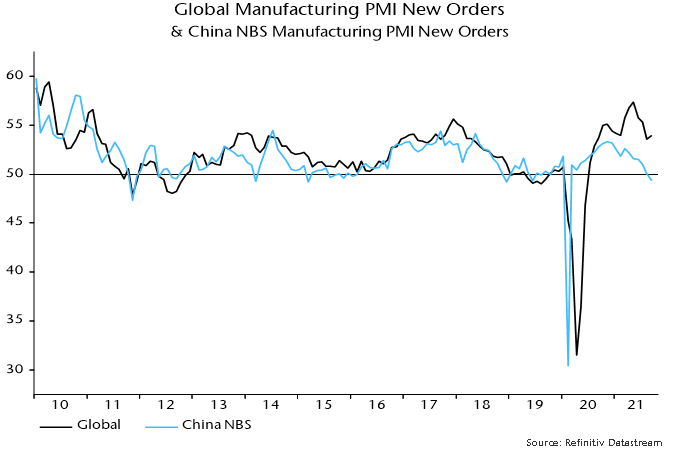
Thirdly, the recovery in the Chinese component of the global index was contradicted by a further fall in new orders in the official (i.e. NBS) manufacturing survey, which has a larger sample size. The latter orders series has led the global index since the GFC – chart 2.
Chart 2
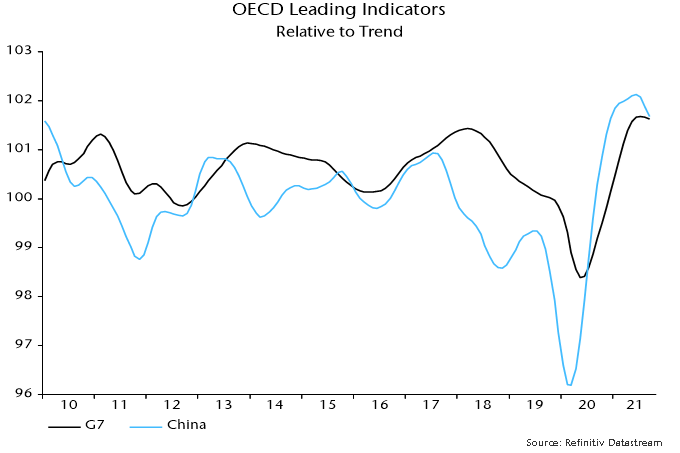
Fourthly, the OECD’s composite leading indicators for China and the G7 appear to have rolled over and turning points usually mark the start of multi-month trends. The series in chart 3 have been calculated independently using the OECD’s published methodology and incorporate September estimates (the OECD is scheduled to release September data on 12 October). The falls in the indicators imply below-trend and slowing economic growth.
Chart 3
Finally, additional August monetary data confirm the earlier estimate here that G7 plus E7 six-month real narrow money growth was unchanged at July’s 22-month low – chart 4. The historical leading relationship with PMI new orders is inconsistent with the latter having reached a bottom in September. The message, instead, is that a further PMI slide is likely into early 2022, with no signal yet of a subsequent recovery.
Chart 4