
Entries from May 30, 2021 - June 5, 2021
Global monetary update: ongoing slowdown, China bottoming?
 Simon Ward
 Post a Comment
Additional country releases in recent days confirm that global six-month real narrow money growth fell further in April, to its slowest pace since January 2020 – see chart 1. The decline from a peak in July 2020 is the basis for the forecast here of a significant cooling of global industrial momentum during H2 2021.
Chart 1

The April fall reflected both slower nominal money growth and a further pick-up in six-month consumer price momentum – chart 2. The latter is probably at or close to a short-term peak and the central scenario here remains that real money growth will stabilise and recover into Q3. The risk is that nominal money trends continue to soften – the boost to US numbers from disbursement of stimulus payments may be over and this year’s rise in longer-term yields may act as a drag.
Chart 2

Six-month growth of real broad money and bank lending also moved down in April, with the former close to its post-GFC average and the latter considerably weaker – chart 3. Forecasts last year that government guarantee programmes would lead to a lending boom have so far proved wide of the mark; monetary financing of budget deficits, mainly by central banks, remains the key driver of broad money expansion.
Chart 3

Charts 4 and 5 shows six-month growth rates of real narrow and broad money in selected major economies. The UK remains at the top of the range on both measures, supporting optimism about near-term relative economic prospects, although slowing QE and a sharp rise in inflation promise to erode the current lead.
Chart 4

Chart 5

Eurozone real money growth, by contrast, is relatively weak: monetary deficit financing has been on a smaller scale than in the US / UK, while six-month inflation is higher than in the UK / Japan. Bank lending has been expanding at a similar pace in the Eurozone and UK. The recent step-up in ECB PEPP purchases could lift Eurozone broad money growth although the change is modest and could be offset by an increased capital outflow – see previous post.
China remains at the bottom of the ranges and monetary weakness was expected here to trigger PBoC easing by mid-year. Policy shifts usually proceed “under the radar” via money market operations and directions to state-run banks. The managed decline in three-month SHIBOR continued this week, while the corporate financing index in the Cheung Kong Graduate School of Business survey stabilised in April / May after falling over October-March, which could be a sign that banks have been instructed to increase loan supply.
The PBOC’s quarterly bankers’ survey, due for release later this month, could provide further corroboration of a policy shift: the differential between loan approval and loan demand indices leads money growth swings – chart 6. Monetary reacceleration in China remains the most likely driver of a rebound in global six-month real narrow money growth – required to support a forecast that H2 industrial cooling will represent a pause in an ongoing upswing rather than a foretaste of more significant weakness in 2022.
Chart 6

Are Fed / ECB balance sheet shifts driving EUR / USD?
Recent US dollar weakness against the euro, like the rally earlier in 2021 and a May-December 2020 slide, may reflect differential growth in net lending to government by the Fed and ECB. Fed net lending has been rising faster recently, possibly contributing to an excess supply of dollars, but the ECB may move back into the lead in H2, suggesting support for the US currency.
Eurozone balance of payments figures, available through March, show a record net outflow of direct and portfolio capital in late 2020 / early 2021. The outflow swamped the current account surplus, resulting in a record “basic balance” deficit, which may have driven a Q1 decline in EUR / USD – see chart 1.
Chart 1

Basic balance positions of currency areas, according to monetary theory, are influenced by the relative pace of domestic credit expansion (DCE), defined as bank lending to government net of government deposits plus lending to the private sector. Central banks have been a key driver of DCE in recent quarters via their QE operations and changes in their government deposit liabilities.
Chart 2 shows stocks of net government lending by the Fed and ECB, together with their ratio. A rise in the ratio implies faster “liquidity creation” by the Fed than the ECB, which – other things being equal – would be expected to imply upward pressure on EUR / USD.
Chart 2

There have been three distinct phases since covid struck:
- The Fed launched additional QE earlier and on a much larger scale than the ECB, resulting in a surge in the ratio in spring 2020. The dollar moved into excess supply, reflected in a sharp rise in EUR / USD into August, with a further move higher into year-end.
- The Fed’s stock of net government lending went into reverse in mid-2020 as a slowdown in QE coincided with a Treasury build-up of cash in its general account at the central bank. PEPP buying, meanwhile, boosted growth of ECB net lending. The rise in relative euro supply resulted in an outflow of Eurozone capital in late 2020 / early 2021, with associated EUR / USD weakness in Q1.
- The Fed / ECB net lending ratio rose again from January as the Treasury ran down its general account balance from more than $1.6 trn to below $800 bn currently, partly to finance $380 bn of stimulus payments over March-May. This has been reflected in a Q2 rebound in EUR / USD towards a December high of 1.23.
What next?
ECB purchases of government securities are currently running at about €110 bn per month versus Fed buying of Treasuries of $80 bn. The Treasury’s latest financing estimates assume a further fall in its balance at the Fed to $450 bn by end-July but a recovery to $750 bn by end-September. The suggestion, therefore, is that the ECB’s stock of net government lending will grow faster than the Fed’s between now and end-September.
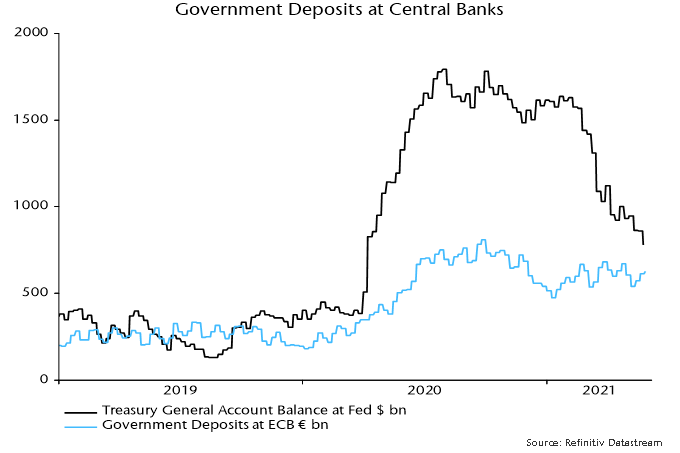
Eurozone governments, moreover, could choose, like the Treasury, to reduce their current large cash balance with the ECB, giving an additional boost to net lending and euro supply – chart 3.
Chart 3
The Fed / ECB net lending ratio could rise further in June / July before turning down and the last three EUR / USD moves began only after a new trend had been established. H2 is looking more promising for the dollar but confirmation of a shift in relative liquidity creation is required.
