Entries from August 9, 2020 - August 15, 2020
Lagging Chinese money growth isn't concerning
 Simon Ward
 Post a Comment
Money measures have surged in most major economies. Narrow money outperforms broad money as a leading indicator of economic activity. Annual growth of the official M1 measure in June was 35.9% in the US, 22.0% in Canada, 15.2% in the UK, 12.6% in the Eurozone and 12.3% in Japan.
Brazil, amazingly, topped the US surge with 38.3% annual growth.
China, however, has lagged – official M1 growth was 6.5% in June and 6.9% in July. This contrasts with the run-up to the 2016-17 global economic mini-boom, when Chinese M1 growth moved ahead of most other countries, reaching a peak of 25.4% versus around 10% for the G7 majors.
For some, Chinese money trends are a key missing link in the global economic rebound story, warranting investors staying underweight cyclical assets and overweight “defensives”.
This is a somewhat strange argument – why should Chinese money data give a better signal for global economic prospects than a global M1 aggregate growing at a record pace despite Chinese sluggishness?
In any case, the suggestion that Chinese narrow money trends are giving a negative signal for Chinese, let alone global, economic prospects, is judged here to be incorrect, for the following reasons.
1. Direction trumps magnitude when assessing the M1 signal. Chinese annual M1 growth has risen from zero in January 2020 to its current 6.9%.
2. The Chinese M1 measure, inexplicably, departs from global convention by omitting household demand deposits, data for which are, however, released monthly. “True” M1, incorporating these deposits, grew by an annual 8.3% in June with the official M1 number suggesting a rise to 8.6% in July*.
3. Relatively sluggish annual growth reflects weakness in H2 2019 and conceals solid sequential expansion since early 2020. Six-month growth of true M1, seasonally adjusted, was an estimated 7.0% in July, or 14.5% annualised.
4. The recent acceleration has been stronger in real terms because of a sharp fall in six-month consumer price momentum driven by declining energy costs and a slowdown in pork prices.
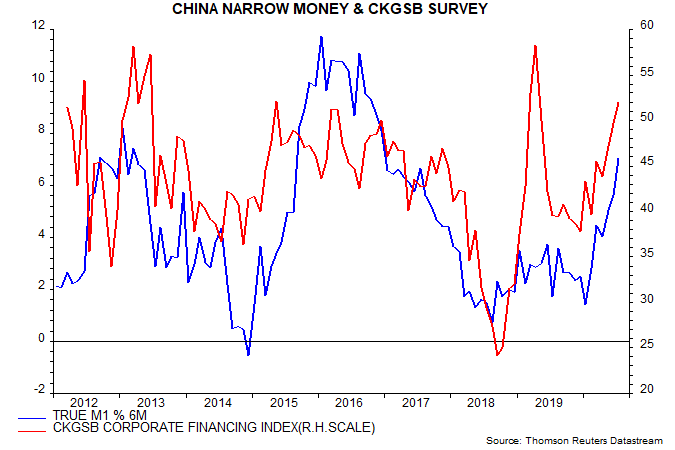
5. Narrow money acceleration has been accompanied by an easing of credit conditions, reflected in the corporate financing component of the Cheung Kong Graduate School of Business (CKGSB) survey of private firms – see chart. Credit conditions tightened sharply after April 2019 as regional banks faced funding difficulties and restricted loan supply, with a knock-on negative impact on economic activity and narrow money demand. The strong rebound in the CKGSB index supports economic optimism and suggests a further rise in six-month true M1 growth.
*The household demand deposits number for July yet to be released – the estimate assumes that annual growth of such deposits remained at 12.0%.
Equities / cash switching rule update
The "monetarist" equities / cash switching rule followed here recommends unhedged global equities (MSCI World index) only when the following two conditions are satisfied:
1. Six-month change in global (i.e. G7 plus E7*) real narrow money above six-month change in industrial output;
2. 12-month change in global real narrow money above slow moving average (currently at 5.6%).
The thinking is that fulfilment of the two conditions is likely to indicate that money holdings are growing faster than the demand for money to support economic activity, in turn suggesting that demand for financial assets, including equities, will increase, with associated upward pressure on prices.
The rule is applied at the end of each month and allows for data reporting lags – one month for real money and two months for industrial output.
The first chart compares the backtested cumulative return relative to Eurodollar deposits from following the rule with the return on equities (the horizontal sections represent periods when the rule was in cash).
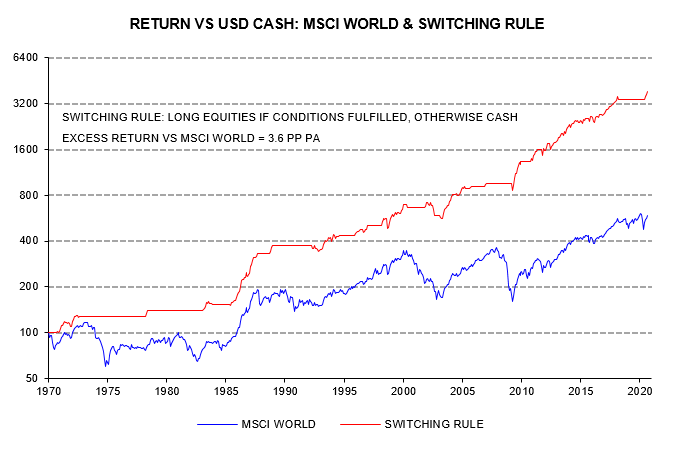
The rule was in cash at the start of 2020 because condition 2 was unmet. Global 12-month real narrow money growth crossed above the slow moving average in March, surging to 8.8% from 4.7% in February. Accounting for the one-month reporting lag, the rule switched into equities at end-April.
No judgement is applied in implementing the rule. Weekly US money data released on 2 April showed that annual narrow money growth had jumped from 6.2% in February to 17.0% in the week ending 23 March. Allowing for a US weight of 28%, this was a strong signal that the global 12-month real narrow money growth measure would cross above the moving average in March. The MSCI World index rose by 13.9% between 2 April and month-end, when the rule switched into equities.
12-month global real narrow money growth stood at 16.6% in June, far above the moving average. Condition 2 is likely to remain satisfied through H2 2020.
The six-month rate of change differential between global real narrow money and industrial output peaked at record 26.5 percentage points (pp) in April, narrowing to 20.8 pp in June as a V-shaped industrial recovery started to unfold – second chart.
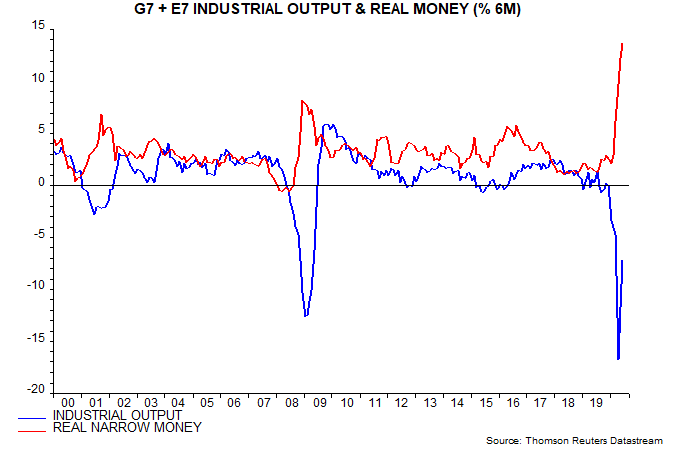
The monthly rise in global real narrow money has fallen from a March peak of 3.9% to 3.6% in April, 2.8% in May and 1.6% in June. Suppose that monthly growth is maintained at 1.6% while global industrial output rises at a constant rate to return to its December 2019 level in December 2020 – regarded here as a plausible scenario. On these assumptions the six-month rate of change differential between global real money and output would turn negative in October, causing the switching rule to recommended a move out of equities into cash at end-December.
Any such cross-over could prove short-lived – industrial output could slow sharply when a V recovery is complete while low rates and continued QE could sustain solid money growth.
As previously discussed, real Treasury yields are usually sensitive to changes in the real money / output growth differential. A rise in real yields over coming weeks would support the view that the monetary backdrop for equities is starting to become less favourable.
*G7 plus seven large emerging economies. G7-only data were used pre 2005.
Still looks like a "V"
The central view here remains that the global economy is staging a V-shaped recovery – or an italic V, at least – from the covid shock (not recession), with industrial output / GDP likely to regain pre-crisis levels in late 2020 / early 2021.
Most countries have now released June industrial output and retail sales data. Aggregate real retail sales in the G7 and seven large emerging economies are estimated to have matched the pre-crisis high reached in September 2019 – see first chart.
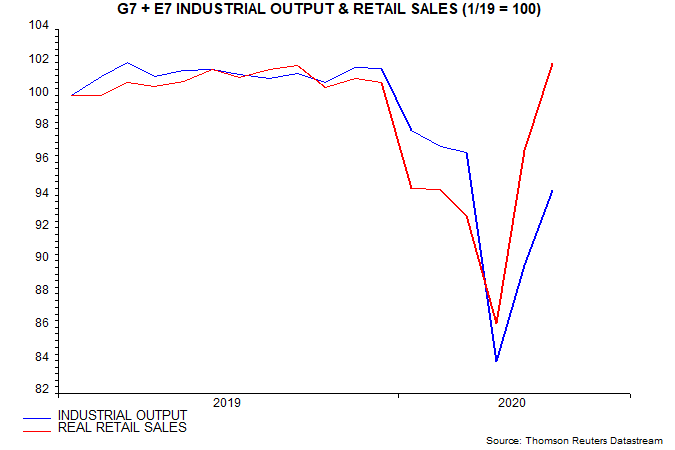
Industrial output rose by an estimated 5.1% following a 7.0% May increase and has now retraced 59% of the December-April decline.
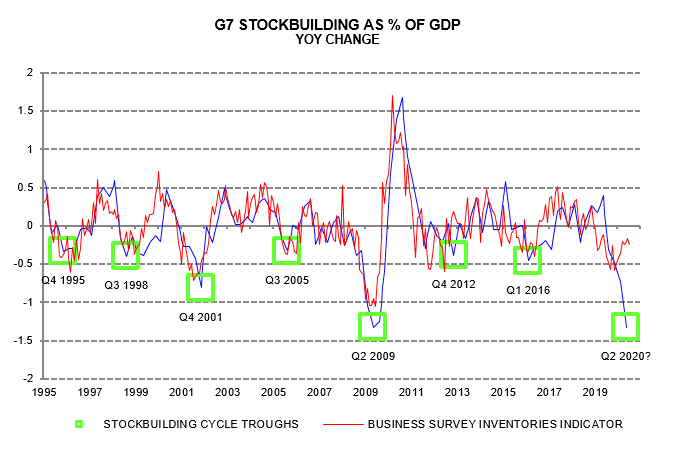
The stronger recovery in consumer goods demand than output appears to have been reflected in heavy Q2 destocking – second chart. Previous posts suggested that the stockbuilding cycle had bottomed in Q1, based partly on firms’ assessment of stock level adequacy, but covid production restrictions forced further involuntary inventory liquidation last quarter. Restocking should give a major boost to industrial output in H2, causing it to outpace / overshoot sales.
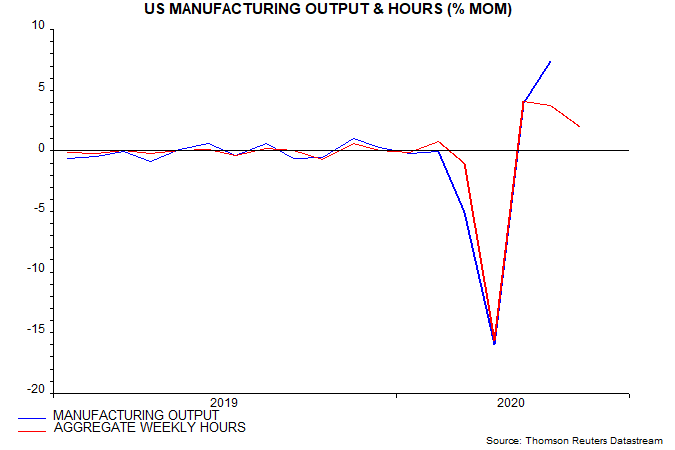
Global industrial output is likely to post another bumper rise in July. US aggregate manufacturing hours were up a further 2.0% last month – third chart.
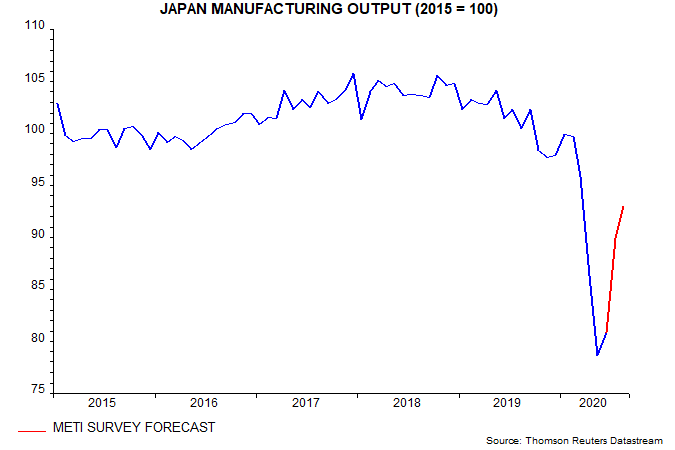
Japan has lagged the global recovery but manufacturers expect a 15.1% July-August output surge, according to METI – fourth chart.
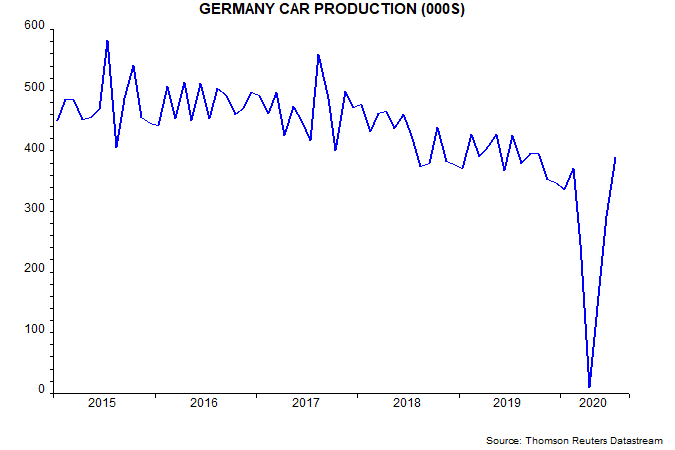
German car production, meanwhile, normalised in July – fifth chart.
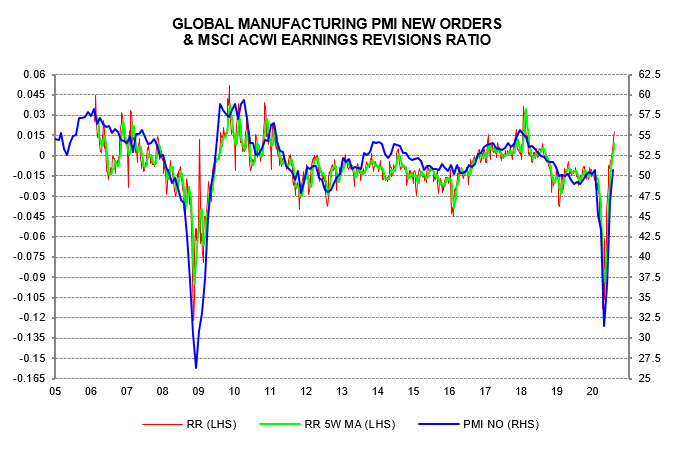
The global manufacturing PMI new orders index regained the 50 level in July, with the equity analysts’ earnings revisions ratio leading the move higher and suggesting a further rise to 55+ – sixth chart.
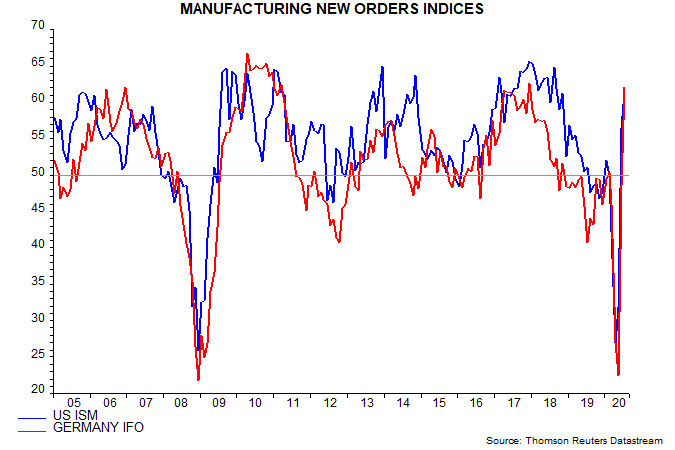
National manufacturing surveys are consistent with a further PMI gain: new orders indices in the US ISM and German Ifo surveys shot above 60 last month – seventh chart.
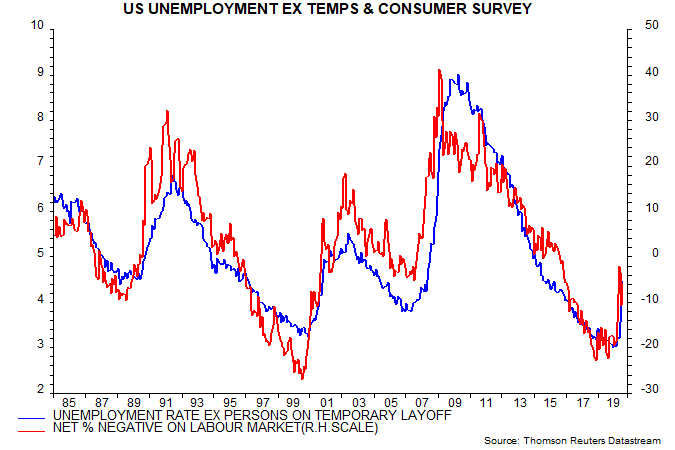
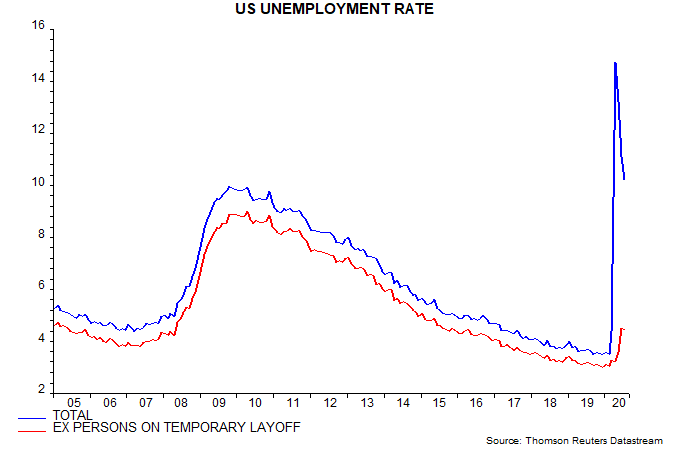
The recall of furloughed workers resulted in another larger than expected decline in US unemployment in July, with the "permanent" rate, excluding temporary layoffs, encouragingly stable at 4.4%, below a long-run average (since 1985) of 5.1% – eighth chart.
The suggestion that labour market damage has been contained is supported by the Conference Board consumer survey, showing negativity about job availability and prospects similarly below the long-run average – final chart.