
Entries from September 8, 2019 - September 14, 2019
US core CPI inflation: fade the pick-up
 Simon Ward
 Post a Comment
US annual CPI inflation excluding food and energy rose to 2.39% in August, the highest since 2008. Is the pick-up in core inflation long predicted by Phillips curve adherents finally materialising?
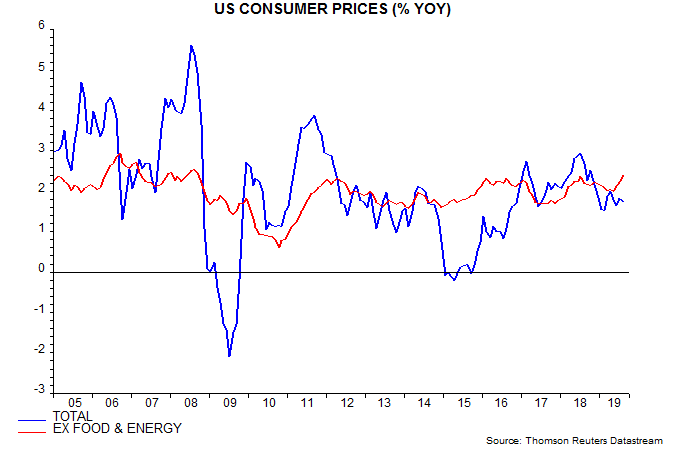
A detailed examination suggests not. The ex. food and energy measure has been pushed up by the goods and medical care components – second chart. The goods rise partly reflects tariff effects while the medical care component has been boosted by surging health insurance costs – up by 18.6% in the 12 months to August.
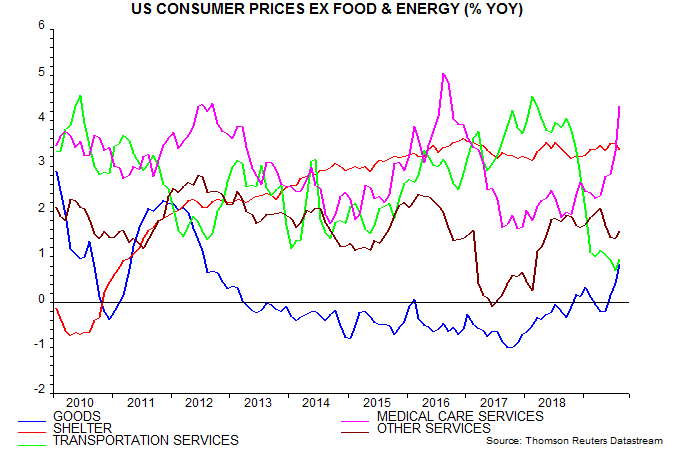
The health insurance component of the CPI is an indirect measure based on insurers’ retained earnings – current strength partly reflects a fall in pay-outs. The equivalent component of the Fed’s favoured price gauge, the personal consumption expenditures index, is much weaker, rising an annual 1.4% in July.
Hikes in tariffs and health insurance costs represent “cost-push” inflation and are demand-deflationary.
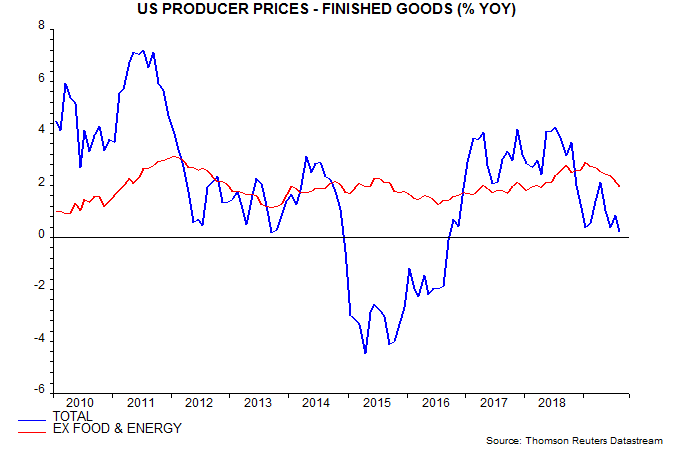
Producer price data signal weakening core goods pressures: annual finished goods inflation ex. food and energy peaked in January and fell further in August – third chart.
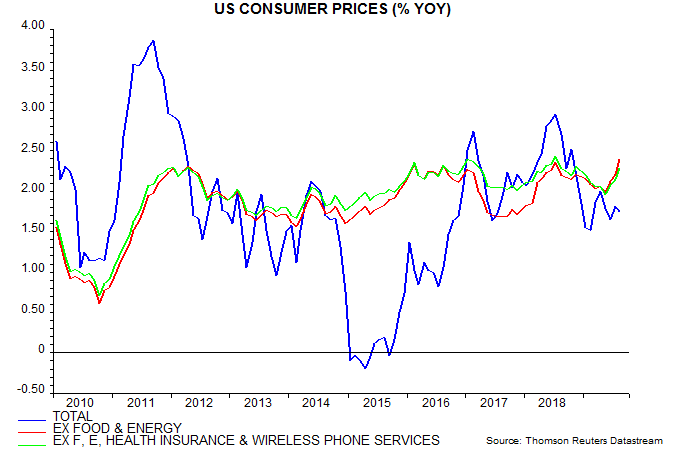
The current boost to the CPI from the tiny health insurance component recalls an even larger drag from the similarly-small wireless phone services component in 2017 – their current weights are 1.2% and 1.6% respectively. The fourth chart shows a measure of core CPI inflation excluding both components – this has been significantly less volatile and remains within its recent range.
Labour market watch: global vacancies weakness
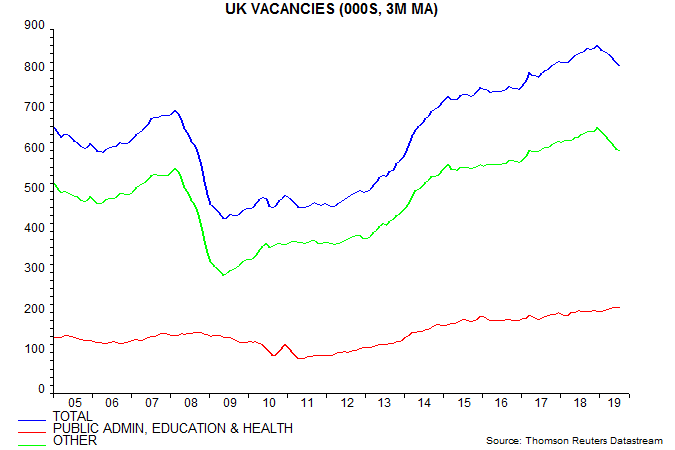
UK labour market trends remain consistent with the view here that the economy has entered a recession.
This view was seemingly undermined by Monday’s news of a 0.3% monthly rise in GDP in July. The monthly numbers, however, are volatile and revisions tend to be downwards when the economy is weakening – at the start of the 2008-09 recession, GDP was initially estimated to have risen by 0.2% in Q2 2008 but is now reported to have declined by 0.7%.
Aggregate hours worked, measured on a three-month rolling basis, fell by 0.4% between April and July. Such a three-month decline is not unusual but a further drop in the stock of vacancies suggests that weakness will extend – see first chart.

The percentage fall in vacancies is now similar to a decline before the 2011-12 double dip scare. Weakness then was due to public sector job cuts but the current reduction is being driven by private employers, suggesting that it reflects contracting activity (as opposed to fiscal consolidation) – second chart.
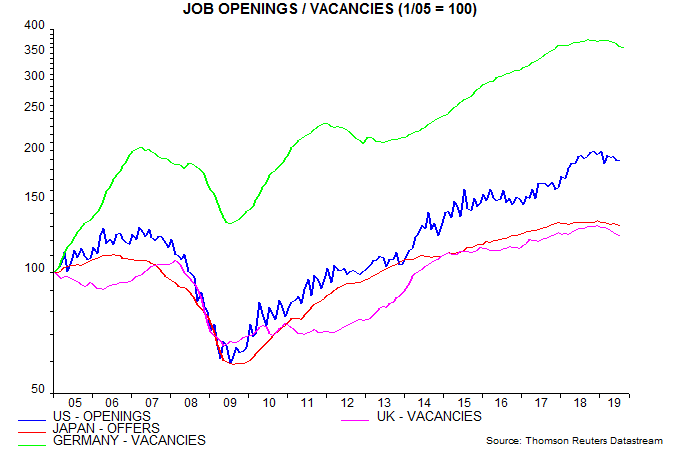
Vacancies or job openings / offers are now falling simultaneously in the US, Japan, Germany and UK for the first time since the 2008-09 recession – third chart.
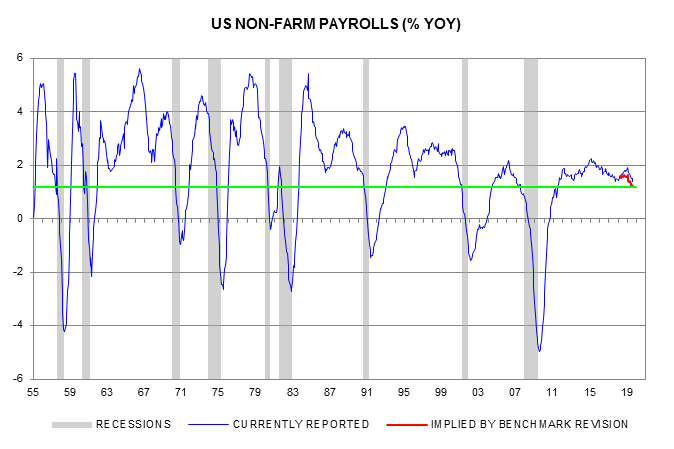
Annual growth of US non-farm payrolls fell to 1.4% in August, the lowest since 2017. Current data, however, do not incorporate a BLS estimate that the payrolls rise between March 2018 and March 2019 was overstated by 501,000 – revised figures will be issued in February 2020. Assuming that monthly payrolls changes between April 2018 and March 2019 were 42,000 (501,000 divided by 12) lower than currently reported, the “true” annual growth rate for August was 1.2%. Since the mid 1950s, falls in annual payrolls growth to this level have occurred only in the context of recessions – fourth chart.
Global momentum bottoming, not turning: investment thoughts
August PMI results are consistent with the long-standing expectation here that global industrial momentum would bottom around Q3 2019 but narrow money trends have yet to signal an economic recovery. Turning points in industrial momentum are usually associated with a rotation in financial markets but the still-weak economic outlook suggests that any such change will be muted or delayed.
Global manufacturing PMI new orders were little changed for a second month in August, while order backlogs reversed a July fall – see first chart. The new orders-inventories differential – regarded as a leading indicator – dropped back but remains above a March low. These developments hint at a stabilisation of industrial momentum following an 18-month slide.

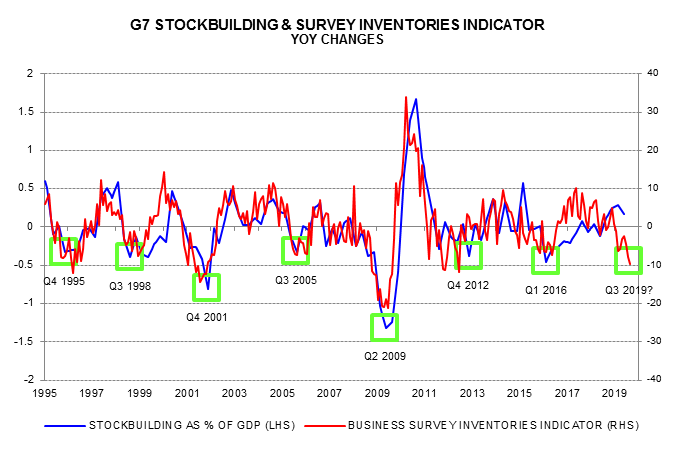
The view that momentum would reach a trough around Q3 was based partly on the stockbuilding cycle, which has an average duration of 3 1/3 years and last bottomed in H1 2016. The cycle is illustrated by the second chart, showing the contribution of stockbuilding to the annual change in G7 GDP. This was still positive in Q2, suggesting that the cycle downswing could last for several more quarters before reaching a trough.

Business surveys, however, are signalling a major inventories downdraft during H2 – the third chart shows a survey-based measure that correlates with and sometimes leads the GDP stockbuilding data. This indicator has fallen to levels consistent with a cycle low, which may be confirmed – after the event – by the GDP data for Q3 / Q4.
The reasons for doubting that a low in industrial momentum associated with a trough in the stockbuilding cycle will be followed by an economic recovery are 1) global real narrow money growth remains weak and 2) the business investment cycle remains in a downswing and may not bottom until H1 2020.
On 1), global six-month real narrow money growth fell back in July and early indications for August are disappointing – US weekly numbers have been weak and global six-month consumer price inflation appears to have remained elevated.
On 2), a trough in the investment cycle is usually marked by the annual change in G7 business investment turning significantly negative and undershooting the annual change in real operating profits, which recovers first. Based on Q2 data, these conditions may not be met for several more quarters – fourth chart.

Financial market trends typically reverse around stockbuilding cycle troughs. The table shows that the pattern of returns during the current cycle downswing – assuming a Q3 trough – has been similar to an average of seven previous cycles. In particular, US equities and quality stocks have outperformed, emerging markets have been under pressure, the US dollar has strengthened and Treasury yields have fallen.
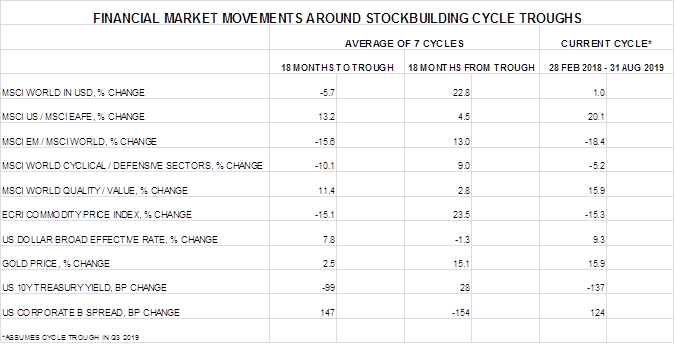
A view that the stockbuilding cycle is bottoming would normally imply that investors should rotate portfolios in favour of international / EM equities, value stocks, foreign currencies, commodities and credit, while reducing exposure to defensive US / quality equities and “safe” bonds. With an economic recovery likely to be delayed, however, such a shift could be premature.
Global equities, unusually, have risen during the current stockbuilding cycle downswing – an additional reason for thinking that defensive trends in markets may be incomplete.
A possible approach is to adjust exposure to areas that have already out- or underperformed by more than average for stockbuilding cycle downswings while retaining an overall cautious strategy. This would suggest, for example, reducing US / quality in favour of EM and value equities while retaining an underweight in cyclical sectors.
There is also a case for focusing a portfolio shift in countries / regions, such as Euroland, where money growth has picked up convincingly, implying an earlier economic recovery.
