
Entries from July 28, 2019 - August 3, 2019
Global economic update: stabilisation but no recovery
 Simon Ward
 Post a Comment
The long-standing forecast here has been that global industrial momentum would reach a low around Q3 2019. The latest business surveys are consistent with this forecast.
The global manufacturing PMI new orders index edged up in July, while the difference between the orders index and an average of inventory indices for inputs and finished goods – a leading indicator – rose to a five-month high.

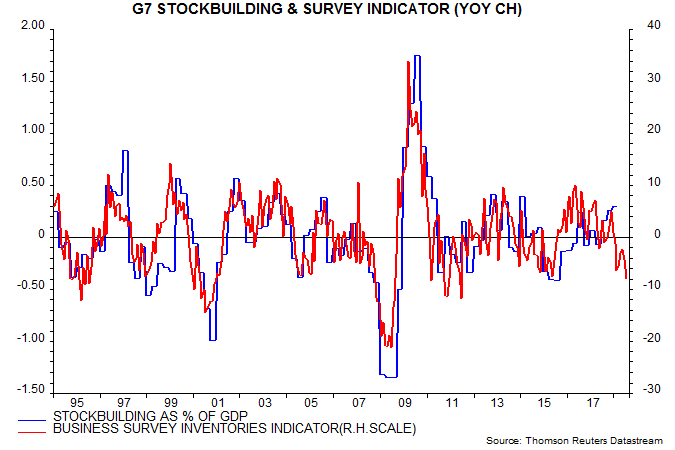
The suggestion that the negative impact of the stockbuilding or inventory cycle is peaking is supported by national business surveys. The second chart shows the contribution of stockbuilding to G7 annual GDP growth along with a proxy indicator derived from national surveys (ISM, Ifo, Insee etc). The contribution was still significantly positive in Q1 but the indicator points to a large drag in Q3 / Q4. Its current level is consistent with the stockbuilding cycle moving into a low.
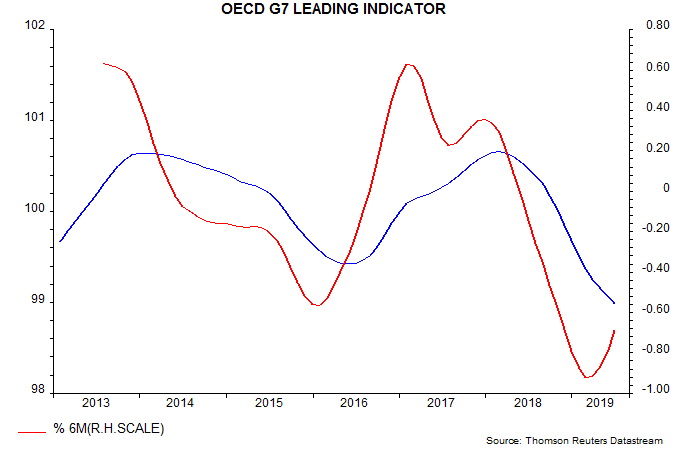
The business surveys feed into the OECD’s widely-watched leading indicators. The OECD will release June indicator data (incorporating the July survey results) on 8 August. With most of the component information available, an independent calculation is possible. The G7 leading indicator is estimated to have fallen further in June but the pace of decline continues to slow – third chart. The six-month change bottomed in February, consistent with a low in six-month industrial output momentum in Q3, based on an average five-month historical lead
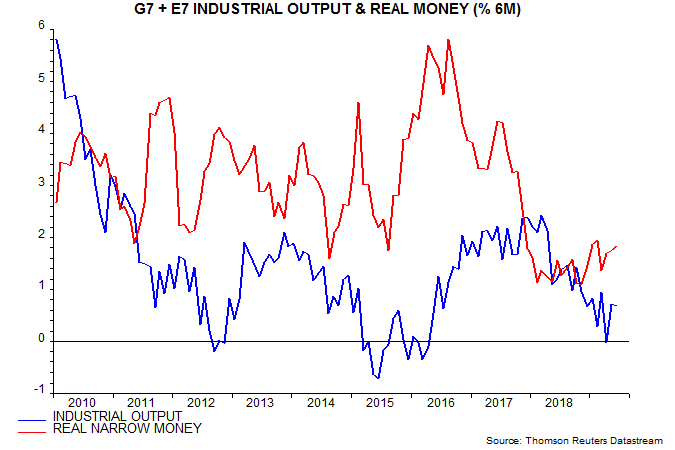
The above observations are not intended to suggest that an economic turnaround is imminent. Near-complete June monetary data confirm an earlier estimate that global six-month real narrow money growth remained beneath its recent February high of 1.9%, at 1.8% – fourth chart. The judgement here remains that a rise to 3% is needed to signal an economic recovery. The current message is that economic weakness will persist through Q1 2020, at least. A fall below the November 2018 low of 1.1%, of course, would negate the view that economic momentum is in the process of bottoming.
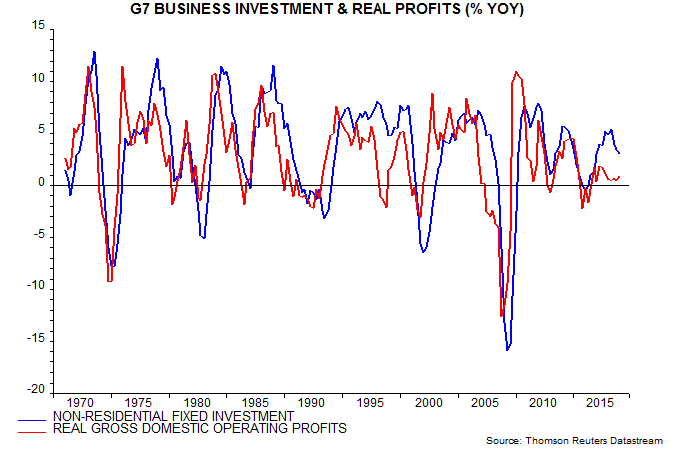
An additional reason for caution is that the business investment cycle appears further from troughing than the stockbuilding cycle. The annual rate of change of G7 business investment, while falling, was still significantly positive in Q1, with sluggish profits suggesting weakness – fifth chart. The investment downswing may not bottom until Q4 or Q1 2020, by which time the annual change is likely to be negative.
The suggestion of further investment weakness is supported by the sectoral breakdown of the global manufacturing PMI new orders index, with the investment goods component falling to a new low in July – sixth chart.
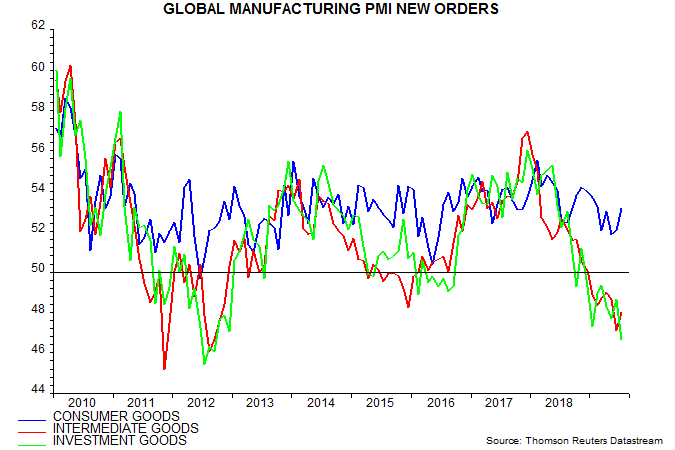
The resilience of consumer goods orders accords with the cycle analysis, which interprets current economic weakness as producer-driven – i.e. due to the stockbuilding and business investment cycles. Consumer-led downturns are driven by housing busts but the housing cycle remains in a longer-term upswing. Consumption momentum, nevertheless, is expected to fade over coming quarters as unemployment moves higher.
US profits revision suggesting weaker outlook
The big news in last week’s US GDP release was a huge downward revision to corporate profits growth in recent years.
The national accounts measure of post-tax “economic” profits – adjusted for stock appreciation and to reflect “true” depreciation of capital assets – was revised down from $2,031 billion to $1,855 billion for 2018, a cut of 8.7%. Profits in Q1 2019 were unchanged from Q3 2014 – see first chart.
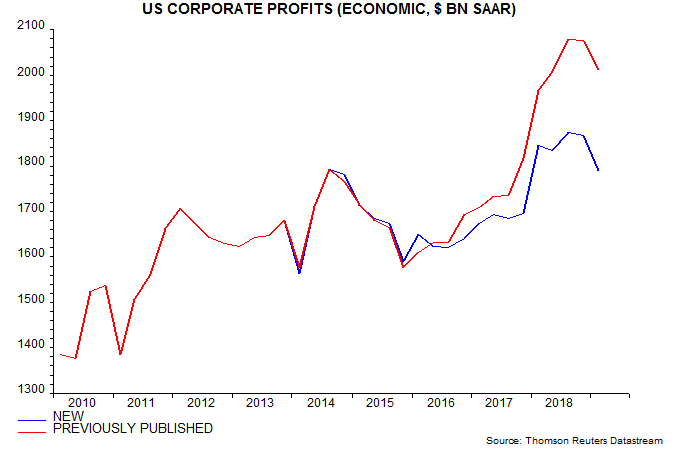
The downward revision reflected the incorporation of comprehensive annual data from corporate tax returns. The cut in profits was balanced by upward revisions to employee compensation and net interest costs.
Last year, some analysts cited strong growth of national accounts profits as a reason for economic optimism. A post at the time warned that early national accounts numbers were often revised significantly. Real-time profits were rising immediately ahead of the last two recessions but the numbers were subsequently revised to show falls.
The business sector was previously reported to be a net lender to the rest of the economy in Q1 2019, with saving exceeding investment by 0.9% of GDP. The new data show a deficit of 0.8% of GDP – second chart. This excludes borrowing to finance net equity retirement – 3.5% of GDP in Q1.
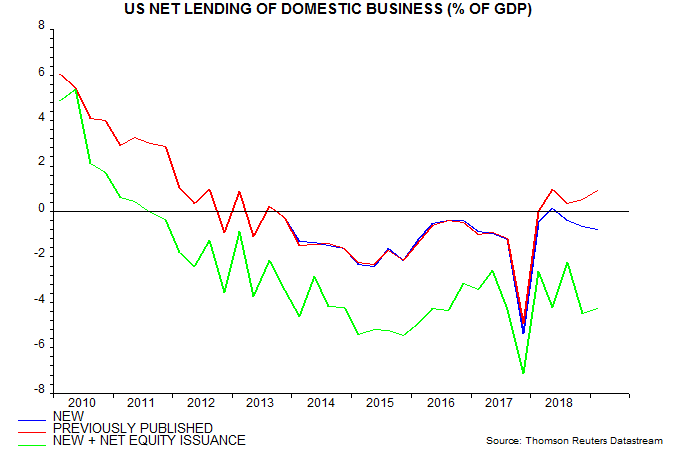
The weaker financial position than previously reported supports the pessimistic view here of prospects for business investment and employment.
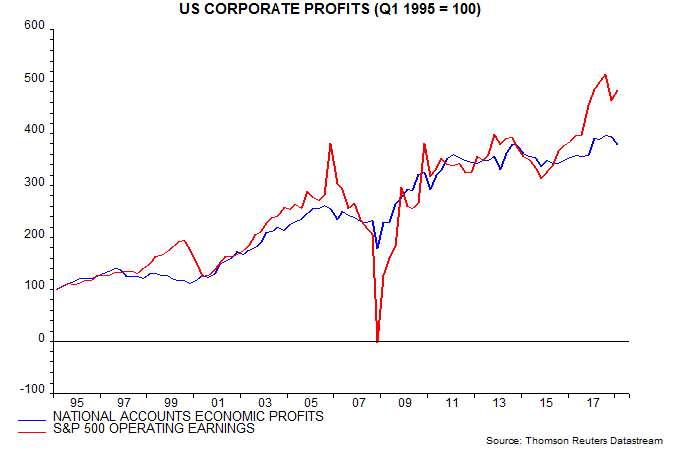
The new national accounts profits numbers show a marked divergence from S&P 500 operating earnings. The latter rose by 57% from a low in Q4 2015 through Q1 2019 versus an increase of only 13% in the national accounts series – third chart.
One reason for the difference is that the national accounts series encompasses smaller and unquoted companies – S&P 500 operating earnings are equivalent to about two-thirds of the national accounts total. Profits of these smaller firms may have been underperforming.
The national accounts series measures income from current production, excluding non-recurring items such as capital gains / losses, restructuring charges and bad debt provisions. While the definition of operating earnings is similar, the adjustments made by S&P may be less comprehensive and rely on data provided by companies in their financial statements rather than tax returns.
A similar large divergence between S&P 500 operating earnings strength and stagnant or falling national accounts (revised) profits occurred ahead of the 2001 and 2008-09 recessions and was “resolved” by a subsequent decline in S&P earnings.
