Entries from July 14, 2019 - July 20, 2019
Global economic update: beware "false dawn" PMI bounce
As discussed in Tuesday’s post, global narrow money trends suggest that economic momentum will bottom out in the third quarter of 2019 but remain weak into early 2020.
The monetary signal has been confirmed by a global non-monetary leading indicator based on the OECD’s country leading indicators. The six-month rate of change of this indicator appears to have bottomed in early 2019 and typically leads by 4-5 months – see first chart.

Neither money trends nor the leading indicator are yet suggesting an economic recovery, in the sense of a return to trend growth.
A further reason for expecting economic momentum to bottom out around the third quarter, discussed in previous posts, relates to the global stockbuilding or inventory cycle, which averages 3.5 years in length, i.e. measured from trough to trough.
The second chart shows the contribution of stockbuilding to annual G7 GDP growth. The last trough occurred in the first quarter of 2016, suggesting another low in the third quarter of 2019, assuming that the current cycle is of average length.

The growth contribution was still significantly positive in the first quarter of 2019 – the last data point in the chart – raising the possibility that the current cycle will be longer than average, implying a later trough.
However, two pieces of evidence suggest a rapid weakening in recent months – a third-quarter low, in other words, remains plausible.
First, an indicator derived from G7 business survey responses about inventories correlates with the GDP stockbuilding data but is more timely and sometimes leads, and this indicator turned significantly negative in early 2019, though has yet to reach an extreme suggestive of a cycle low – third chart.

Secondly, global retail sales volumes have rebounded strongly since end-2018, far outpacing industrial output – fourth chart. This suggests a significant drawdown in inventories unless spending on capital goods has collapsed.

Retail sales strength is likely to fizzle. It partly reflects a US bounce-back after weakness associated with the government shutdown. In addition, a fall in sequential inflation was a tailwind during the first half but is now reversing. Softening labour markets, meanwhile, are starting to erode consumer confidence.
The forecast of a trough in global industrial momentum in the third quarter suggests that the global manufacturing PMI – a coincident indicator – is at or near a low. The forthcoming July flash results, moreover, could reflect some hope engendered by the Trump-Xi trade truce in late June – this may have influenced yesterday’s stronger Philadelphia Fed manufacturing survey.
The danger is that markets and policy-makers wrongly interpret a bottoming of the manufacturing PMI as a precursor to an economic recovery in late 2019 / early 2019 – ignoring evidence from monetary trends and other leading indicators that prospects remain worryingly weak.
A rebound in bond yields as expectations of central bank policy easing are reined back would risk aborting the recent tentative monetary recovery. It could also trigger another sell-off in equities, which have displayed a strong inverse correlation with real yields in recent months – fifth chart.

Labour market watch: ominous UK vacancies fall
The stock of vacancies – a leading indicator of the number of employees – peaked in January (three-month moving average basis), with another hefty fall in June. Employee numbers appear to have peaked in February (also three-month moving average) – see first chart. A stable unemployment rate of 3.8% reflects slower labour force expansion and a rise in “self-employment”, which have – so far – balanced the stall in employees.

Vacancies are down by 3.9% from the January peak but the fall has been cushioned by a rise in public sector openings: the decline outside public administration, education and health was 6.8% – second chart.

Manufacturing vacancies have plunged 12.5% since January. Other large declines include real estate and “other service activities” (-20%), information and communication (-13%), arts, entertainment and recreation (-9%), financial and insurance activities (-8%) and construction (-7%).
By size of business, the decline has been concentrated among firms with fewer than 50 employees – vacancies for this group are down by 9.6% versus 1.7% for larger employers.
Global money update: signal still downbeat
Global money trends still aren’t signalling an economic recovery.
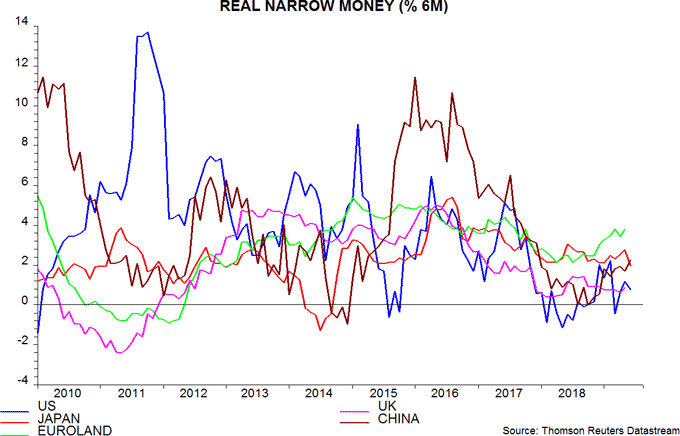
Six-month growth of real narrow money in the G7 economies and seven large emerging economies is estimated to have edged up to 1.9% (not annualised) in June but remains well below a post-GFC average of 3.2% (i.e. calculated over 2010-18) – see first chart. A rise to this level is probably needed to signal an economic recovery, in the sense of a return to trend expansion.

The June increase in real money growth was driven by China – second chart. US growth remains weak and there was a sharp slowdown in Japan, partly inflation-driven. The final June figure will depend importantly on Euroland and UK monetary data, to be released on 24 and 29 July respectively.

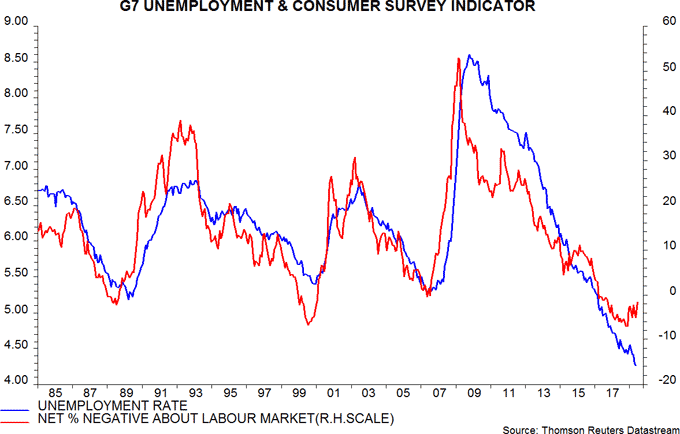
The implication that global economic growth will remain below trend at least through early 2020 suggests a coming rise in unemployment, with attendant additional pressure for central bank policy easing.
The forecast of an unemployment turn is supported by G7 consumer surveys: the net percentage of consumers expressing a negative view of labour market conditions rose to a 21-month high in June – third chart.


