Entries from June 2, 2019 - June 8, 2019
Euroland relative economic prospects / BoP suggesting euro support
Euroland first-quarter GDP details released today support the view here that the Kitchin inventory cycle downswing is further advanced than in other regions – a positive for relative economic prospects.
Firms continued to increase stock levels in the first quarter but the rise, expressed as percentage of GDP, was the smallest since the fourth quarter of 2017. Stockbuilding, by contrast, increased further in the US, Japan and UK and is high by recent historical standards – see first chart.

GDP growth depends on the change in stockbuilding. The annual change has turned significantly negative, consistent with the cycle moving towards a low, while a survey-based leading indicator may be bottoming – second chart.

Euroland money trends also suggest that economic news will hold up better than elsewhere – see previous post.
An improvement in relative news could contribute to a rally in the euro, which has yet to reflect a strengthening of the basic balance of payments position* since mid-2018 – third chart.

As shown by the fourth chart, this strengthening has been driven by a cessation of net outflows on the direct and portfolio investment accounts, in turn reflecting the ending of QE – much of the liquidity previously being created by the ECB was “exported”.

Euroland / US interest rate differentials remain heavily negative but have narrowed, a trend that may continue as US economic weakness causes markets to expect more significant Fed policy easing – fifth chart. The ECB, meanwhile, may be reluctant to consider rate cuts or restarting QE before President Draghi’s successor takes the helm at end-October.

*Current account plus net direct and portfolio investment flows.
Labour market watch: more downbeat news
The view here remains that global economic weakness is spreading to labour markets, implying that it is becoming entrenched and will require more significant policy easing to reverse. Three news items in recent days are consistent with this development.
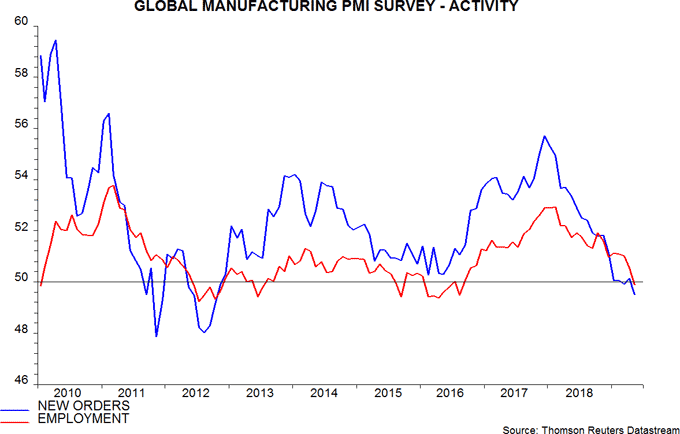
First, the global manufacturing employment index moved below 50 (to 49.9) in May, meaning that more companies (weighted by size) cut rather than added jobs last month. Turning points in the employment index usually lag those in the new orders index, which also fell further in May, suggesting additional weakness in the employment measure – see first chart.

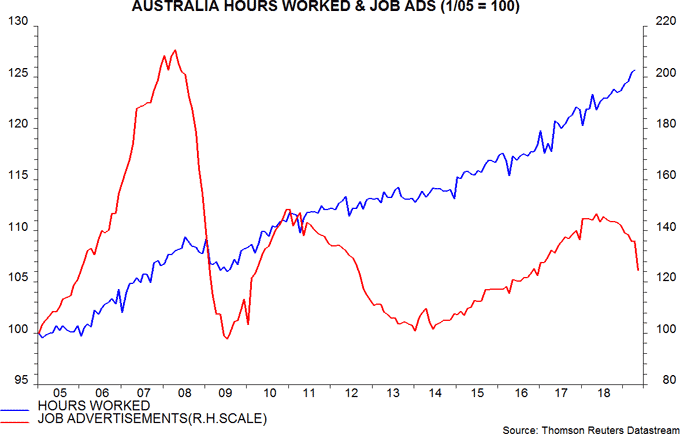
Secondly, following news of further falls in German vacancies and Japanese job offers, Australian job advertisements plunged in May to their lowest level since 2016 – second chart. Accompanying commentary claimed that holiday timings and election uncertainty were largely responsible, implying a June rebound; an alternative interpretation is that the decline in advertisements had paused in April and the big May fall reflects a catch-up effect.

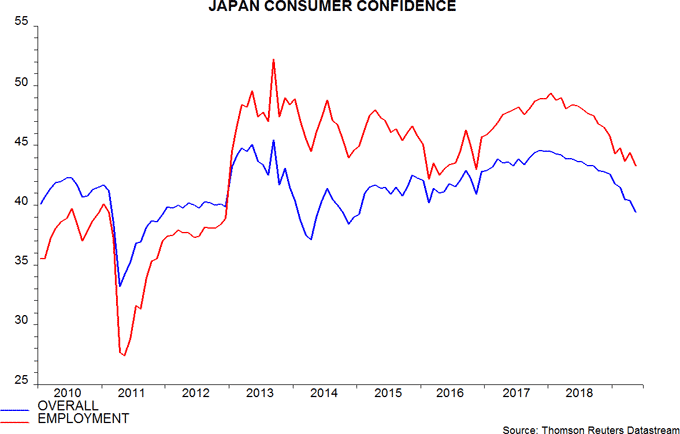
Thirdly, Japanese labour market cooling was confirmed by a further decline in May in the component of the consumer confidence index measuring employment prospects over the next six months – third chart. The recent fall in overall confidence is ominously similar to the slide preceding the April 2014 sales tax rise; consumer spending contracted by 2.0% in the year to the fourth quarter of 2014.


