Entries from May 12, 2019 - May 18, 2019
US C&I loans confirming stocks cycle downswing
Recent US industrial output weakness is judged here to be partly due to a downswing in the Kitchin stockbuilding cycle – firms are cutting production to clear an overhang of inventories. Data on banks’ commercial and industrial (C&I) loans are consistent with this story.
The three economic cycles – stockbuilding, business investment and housing – each drive an associated credit cycle. The stockbuilding cycle shows up in C&I loans, which play a key role in financing inventories.
Three-month growth of C&I loans surged at end-2018, consistent with strong stockbuilding in the fourth-quarter GDP accounts. Growth, however, fell sharply through April, with loans contracting in the latest month – see first chart.

The second chart shows the contribution of stockbuilding to annual GDP growth along with the annual change in three-month C&I loan momentum. The C&I loan series is quarterly, with numbers referring to the final month of each quarter except for the last data point, which is for April. The suggestion from the C&I loan data is that the stocks cycle is now acting as a significant drag on economic expansion.

Global industrial weakness intensifying as Kitchin / Juglar downswings accelerate
US and Chinese April industrial output figures released yesterday undershot expectations, confirming that global industrial activity continues to weaken alarmingly.
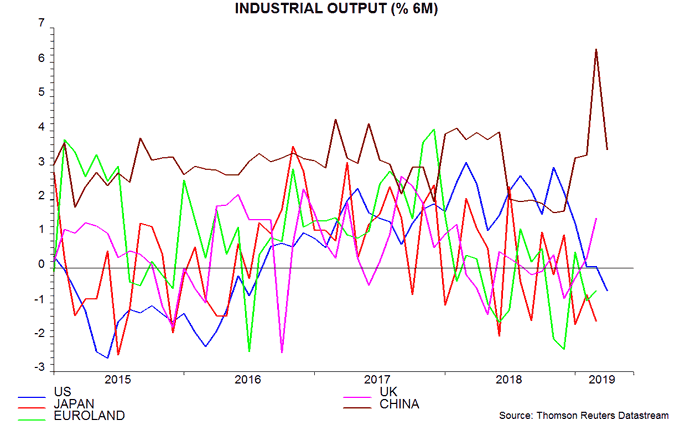
Six-month growth of Chinese industrial output reversed its March spike, confirming that the latter was driven by New Year timing and VAT cut anticipation effects rather than underlying acceleration. US output, meanwhile, posted a shock 0.5% month-on-month fall, with numbers for earlier months revised lower. The six-month decline in output in the US is now on a par with Euroland – see first chart.
The anomalous rebound recently in UK industrial / manufacturing output momentum reflects Brexit-related stockpiling and is likely to reverse sharply.
The US and China have a combined 50% weighting in the G7 plus E7 industrial output aggregate tracked here. Unless output in the rest of the grouping rose by more than 0.5% month-on-month in April (unlikely), the six-month change in the aggregate will turn negative.
The expectation here has been that the six-month change in G7 plus E7 output would bottom around July, based on an October 2018 low in real narrow money growth and an average nine-month lead. The Chinese March output spike, however, has created a significant negative base effect for the six-month change in September 2019, suggesting that the low may be reached in that month.
Industrial weakness, according to the analysis here, reflects joint downswings in the Kitchin stockbuilding and Juglar business investment cycles, both of which are judged to have reached peaks in late 2018. A reasonable expectation, based on their historical lengths, is that the two cycles will bottom in the third and fourth quarters of 2019 respectively but these timings are subject to review in light of incoming evidence. The escalating US / Chinese trade war will further dampen business “animal spirits” and may extend and deepen the Juglar downturn.
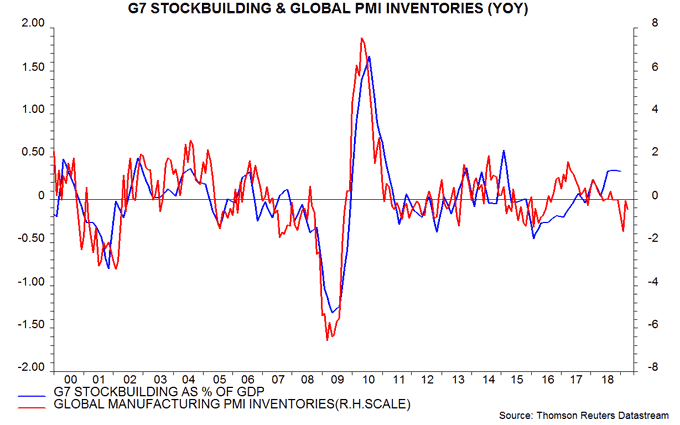
An indication of the Kitchin cycle reaching bottom would be extreme negative readings for several months in the year-on-year change in an average of the global manufacturing PMI inventories indices for finished goods and purchases. This indicator spiked lower in February but rebounded in March and was only moderately negative in April, suggesting that the cycle downswing has yet to reach maximum intensity – second chart.
UK labour market cooling, hawkish MPC off track
Recent posts on UK monetary statistics noted that real narrow money holdings of private non-financial corporations (PNFCs) were contracting, suggesting a faster decline in business investment and weaker labour demand. Yesterday’s labour market report confirms that demand for workers is softening.
The number of employees in employment (three-month moving average) fell in March and was unchanged from December. Year-on-year growth eased to 0.6%, the weakest since December 2016.
The March decline was signalled by a January peak in the stock of vacancies (also three-month moving average), which fell further in April – see first chart.

Softer labour demand, along with a fall in consumer price inflation from 3.0% in January 2018 to 1.9% in March, may already be feeding through to a wages slowdown: annual growth of private sector regular pay fell to a six-month low in March – second chart.

Annual growth of an expanded non-financial broad money measure* eased further to 2.5% in March, the lowest since 2011, signalling a slowdown in nominal GDP and contradicting the MPC’s claim of medium-term upside risk to the 2% inflation target – third chart. The next move in UK rates is likely to be down not up.

*”Non-financial M4++” = M4 holdings and foreign currency UK deposits of household sector and PNFCs plus National Savings plus estimated stock of retail-held UK mutual funds (growth of latter based on flows, i.e. excludes valuation changes).
Chinese money / credit trends still weak before tariff escalation
The PBoC today released detailed monetary data for April, allowing calculation of true M1, the preferred narrow money measure here. Six-month growth of the aggregate, seasonally adjusted, rose to a 14-month high but remains low by historical standards – see first chart. Allowing for the usual lead, the suggestion is that two-quarter nominal GDP expansion will stabilise at a weak level in the second / third quarters and recover modestly towards year-end.

A similarly downbeat message was delivered by April credit numbers released on Friday. Strong monthly flows of total social financing (TSF) in January and March led some commentators to claim that credit growth was picking up. As previously discussed, when seasonally adjusted and scaled by the outstanding stock, the monthly numbers were unimpressive. Six-month TSF expansion continued to move sideways in April, also at an historically weak level – first chart.
The disappointingly small response of narrow money trends to recent policy easing is highlighted by the second chart, showing year-on-year growth of true M1 and the 12-month change in the two-year government bond yield, plotted inverted. Falls in yields in 2005, 2008, 2011-12 and 2014-15 were followed by rises in true M1 growth of between 9.0 and 24.3 percentage points (pp). April true M1 growth of 4.7% was only 1.6 pp above a February low.

An optimist might point out that the lag from interest rate changes to money growth appears to have been lengthening, so a strong monetary pick-up could be about to kick in. The preferred explanation here, though, is that the transmission mechanism of policy has been weakened by the clampdown on shadow banking. This is a key element of longer-term financial reforms and is unlikely to be abandoned in response to an escalating US / Chinese trade war.
Global industrial output contracting ex. China
The forecast here at the start of the year was that global economic momentum – as measured by the six-month rate of change of industrial output in the G7 economies and seven large emerging economies – would continue to weaken through around July 2019. How is this forecast playing out?
Six-month output growth fell to a 33-month low in February but recovered in March – see first chart.

This recovery, however, reflected a surge in Chinese output, partly in compensation for weak activity in January / February but apparently also influenced by stockpiling of inputs ahead of April’s VAT cut – second chart.

Ex. China, global industrial output contracted in the six months to March: G7 output stagnated while production in the rest of the E7 fell at its fastest pace since 2015.
A Chinese April number is due this week and is likely to show a sharp reversal. Year-on-year growth of exports also spiked higher in March but slumped back close to January / February levels last month – third chart.

Assuming a Chinese relapse, G7 plus E7 six-month output growth should resume its fall, moving below the February low. The global manufacturing PMI is consistent with further weakness – fourth chart. The expectation here is that the six-month output change will bottom in negative territory and probably below the 2015 trough.


