Entries from April 14, 2019 - April 20, 2019
China activity data: hold the champagne
 Simon Ward
 Post a Comment
Discount the headlines – the Chinese economy remained soft in early 2019.
Official real GDP numbers are implausibly smooth. Nominal GDP trends are a better guide to economic swings. Nominal GDP changes reflect developments in prices as well as output but a crude adjustment can be made by deflating the numbers by the consumer price index.
The first chart shows two-quarter changes in the above three series, seasonally adjusted*. All three slowed further in the first quarter.

The declines are not an artefact of using two-quarter changes. Quarterly growth of the official real GDP series also fell last quarter, to 1.4% from 1.5% in the fourth quarter.
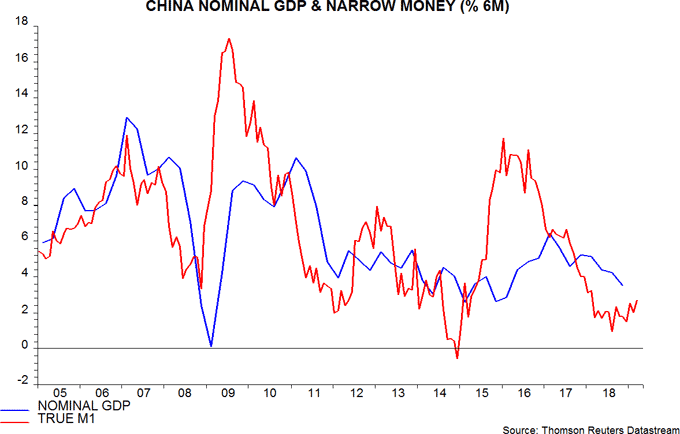
The further slowdown in nominal GDP is consistent with weak money trends in mid-2018: six-month growth of true M1 reached a low in August last year – second chart.

The subsequent stabilisation and recent modest recovery in narrow money growth suggest that nominal GDP expansion is at or near a low and will revive slightly over the remainder of 2019. A 2016-style acceleration, however, is not in prospect, based on current monetary trends.
What about super-strong industrial output numbers for March, showing a surge in year-on-year growth to 8.5% from 5.3% in January-February? Doesn’t this imply an end-quarter economic pick-up that will feed through into significantly better second-quarter GDP results?
Industrial output strength was not reflected in other monthly series. Retail sales growth, adjusted for inflation, fell slightly compared with January-February – third chart.

Growth of fixed asset investment – a value series – edged higher but remains range-bound. As expected, recent profits weakness has fed through to a slowdown in private investment, offsetting a pick-up in government spending – fourth chart.

The March spike in industrial output growth is partly attributable to the timing of the New Year holidays in 2018 and 2019, which resulted in front-end loading of first-quarter production last year and back-end loading this year. This artificially depressed year-on-year growth in January / February, with a compensating boost to March.
In addition, the VAT cut from April created an incentive for companies to bring forward purchases of inputs to benefit from relief at the old rate. Supplier firms boosted output to accommodate this temporary demand. This probably also partly explains the larger-than-expected rises in official and Markit / Caixin manufacturing PMIs last month.
Both reasons suggest a normalisation of output growth in April to around the first-quarter average of 6.5%.
*Real GDP seasonally adjusted by source; own adjustment for nominal GDP.
China money update: additional data less positive
Commentary on Friday suggested that Chinese money trends had improved but were still far from signalling economic strength. Additional March data released today reinforce a cautious interpretation.
The key measure monitored here is true M1, which adds household demand deposits to the official M1 aggregate to align with the internationally-recognised M1 definition. The demand deposit information is usually released several days after the headline money data. Friday’s commentary assumed that household demand deposits rose by 2.0% month-on-month in March. This was a reasonable assumption because such deposits normally move in the same direction as total household deposits but by a larger percentage – total deposits increased by 1.1% last month.
The additional details were released today – earlier than usual – and show that household demand deposits fell by 1.0% in March. Annual true M1 growth, therefore, was 5.2% rather than the estimated 6.3%. Six-month growth, seasonally adjusted but not annualised, was 2.7% versus 3.8%. This still represents an improvement from February but the recent recovery is unimpressive – see first chart.
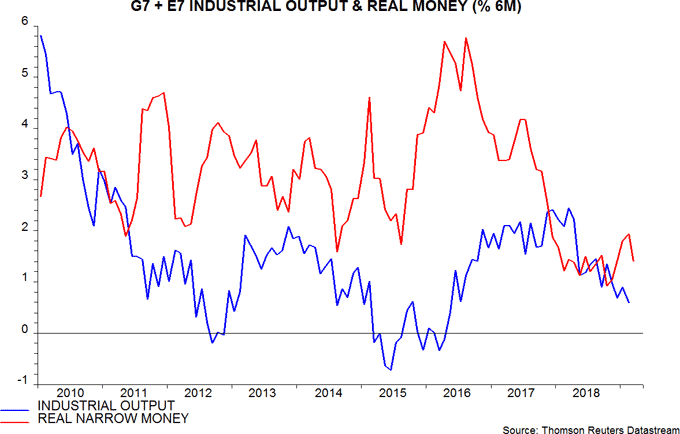
This also has implications for global six-month real narrow money growth, which is now estimated at 1.4% in March rather than 1.6%, implying that last month’s decline reversed half of the recovery between October and February – second chart.