Entries from April 7, 2019 - April 13, 2019
Global money update: US weakness offsets Chinese improvement
China and the US released March money data overnight. The Chinese numbers were positive, though not strong, while US data confirmed a sharp slowdown in narrow money indicated by earlier weekly data. Also factoring in a rise in headline inflation, the net result is that global six-month real narrow money growth is likely to have reversed lower last month, following a small recovery over October-February. This suggests that global economic prospects are deteriorating again, with US weakness likely to offset and delay a tentative Chinese recovery.
The first chart shows six-month growth rates of Chinese narrow / broad money measures and the total social financing (TSF) credit aggregate. Previous commentary expressed disappointment at the lack of response of narrow money growth to policy easing but there was a clear pick-up in March. This confirms an earlier rise in broad money growth, which levelled off in February / March. TSF expansion, meanwhile, ticked higher last month but six-month growth continues to be depressed by soft flow numbers in late 2018.

Growth of narrow money and TSF remains weak by historical standards, with the rises from the recent lows much smaller than before significant economic accelerations in 2009 and 2016. The increases are also less impressive than in 2012, when nominal GDP growth subsequently stabilised but did not strengthen.
The second chart compares six-month growth rates of real narrow money across major economies and includes March data for Japan as well as the US and China. The rise in Chinese real money growth in March was smaller in magnitude than a US move from expansion back into contraction. Of the 2.6 percentage point (pp) US fall, 2.2 pp reflected nominal money weakness and 0.4 pp an energy-driven rebound in inflation. The level of US real narrow money is lower now than in late 2017.

The global real money measure in the third chart also incorporates March data for India (strong, partly reflecting an election effect) and Brazil (weak). Six-month growth is estimated to have fallen back from 2.0% to 1.6% – below the level in all but one month over 2009-17.

As previously discussed, the inflation drag on global real money growth is likely to increase into mid-year, reflecting recent commodity price gains – fourth chart.

A "monetarist" perspective on current equity markets
The forecasting approach employed here – relying on monetary and cycle analysis – suggested that global economic momentum would continue to weaken through the first half of 2019. Incoming news has supported the scenario but equity markets have rallied strongly, partly reflecting an inflation-driven improvement in the monetary backdrop. We doubt that this will be sustained and expect further weak data to undermine investor hopes of an early economic recovery.
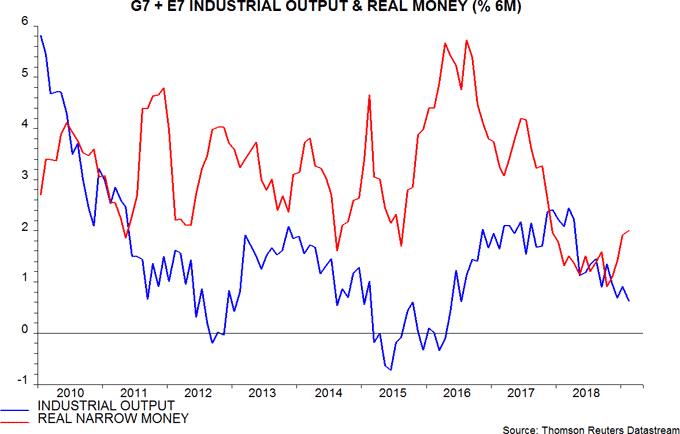
The monetary aspect of the forecasting process relies on the empirical rule that turning points in real (i.e. inflation-adjusted) money momentum lead turning points in economic momentum, on average by about nine months. The narrow M1 aggregate – comprising currency in circulation and demand or overnight deposits – has provided more reliable signals historically than broader money measures. Global six-month real narrow money growth reached a 10-year low in October 2018, recovering through February 2019. The October low suggested that a low in economic momentum was unlikely to be reached until around July 2019. Consistent with the forecast, six-month industrial output expansion is estimated to have fallen further through February 2019 – see first chart.

Why, then, have equity markets rallied? The economic slowdown has fed through to earnings forecasts – the IBES consensus estimate for MSCI World EPS in 2019 was cut by 5.1% between December and March – but the impact on equity prices has been more than offset by a fall in the discount rate as risk-free real yields have tumbled. We attribute this partly to the Fed’s policy U-turn and partly to the recovery in global real money momentum between October and February, which resulted in our two “excess” money indicators turning positive*. Excess money is associated with excess demand for financial assets at their prevailing prices, and consequent upward pressure on those prices (and downward pressure on yields).
In terms of our framework, a forecast that equity markets will rise further requires belief that 1) the recovery in monetary trends since October presages a significant revival in economic momentum later in 2019, 2) investors will “look through” intervening further weakness and 3) excess money will continue to support asset prices. We are sceptical on all three counts.
On 1), the rise in global six-month real money growth since October has been modest, with the February level – 2.0% – lower than in all but three months between October 2008 and November 2017. A further increase to 3% or more may be needed to signal a return to trend economic expansion.
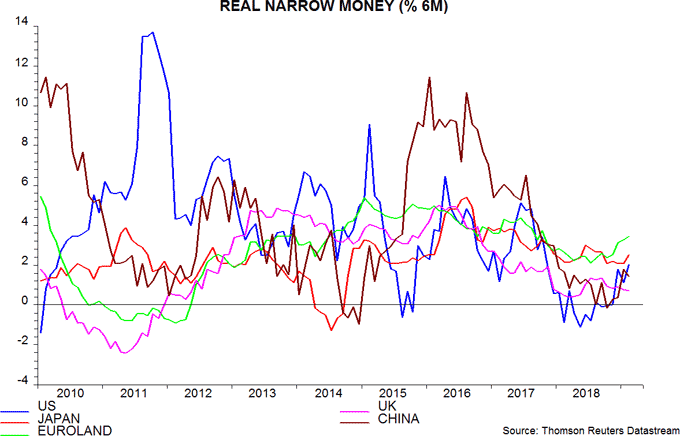
The recovery, moreover, has been driven by a slowdown in six-month consumer price inflation, as weakness in oil and other commodity prices in late 2018 fed through to headline indices. Nominal money growth has remained within its 2018 range – second chart. With commodity prices recovering in early 2019, the inflation decline is likely to reverse into mid-year. Real money growth, therefore, may fall back unless nominal monetary trends strengthen.

On 2), equity markets are less forward-looking than many investors perceive. We examined the behaviour of global equity prices around 13 prior lows in six-month industrial output momentum since 2000. Equities fell after the trough in four cases, while lows coincided on one occasion. In the remaining eight instances, equities bottomed a maximum of six months before the low in economic momentum, with an average lead of 2.75 months.
Equity bulls believe that markets bottomed in December 2018. If our forecast of a low in economic momentum in July 2019 proves correct, this would imply a seven-month lead – outside the historical range.
On 3), we anticipate that one of our two excess money measures will turn negative because of the expected inflation rebound into mid-year.
The third chart shows monetary developments in individual major economies. US real narrow money contracted in the year to November 2018, suggesting weak economic prospects for the first three quarters of 2019. Money trends recovered modestly in early 2019 but weekly data for March – not included in the chart – indicate a sharp set-back. Accordingly, we do not expect the US economy to return to strong growth before 2020.

Investors are hoping that a policy-driven pick-up in Chinese activity will lift global economic expansion later in 2019. Chinese real narrow money growth has revived since late 2018 but the increase to date has been much smaller than those preceding economic recoveries in 2009, 2013 and 2016. We expect activity news to disappoint near term and await a more convincing monetary acceleration to become positive on prospects for late 2019 / early 2020.
Euroland economic news was particularly disappointing in late 2018 / early 2019, contributing to equity investors moving significantly underweight the region, according to surveys. Real narrow money growth, however, has rebounded since mid-2018 and is higher than in other major economies, arguing against recession concerns – real money contracted before the 2008-09 and 2011-12 downturns. GDP expansion may stabilise in the first half of 2019 and recover later in the year – barring external shocks.
The cycles element of the forecasting approach provides longer-term context and acts as a cross-check of the monetary analysis. The two cycles of interest at present are the stockbuilding or inventory cycle, which has averaged 3 ½ years in length in recent decades (measured from trough to trough), and the longer-term business investment cycle, averaging 8 ½ years.
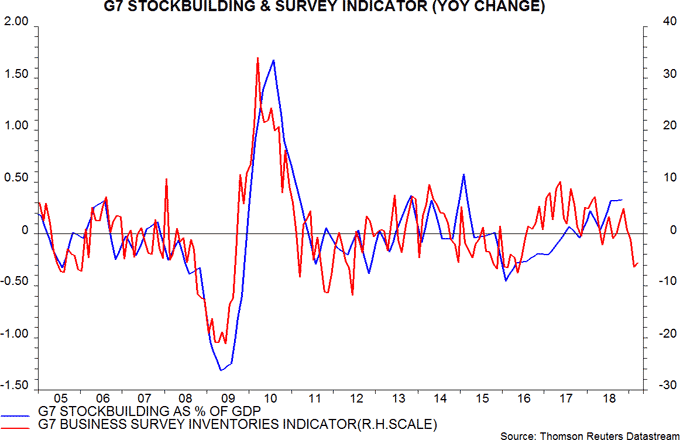
The stockbuilding cycle, on our analysis, last bottomed in the first quarter of 2016, implying that another trough could occur around the third quarter of 2019, assuming that the current cycle is of average length. The contribution of stockbuilding to G7 annual GDP growth rose to a 15-quarter high in the fourth quarter of 2018, consistent with the cycle being at or near a peak, while more recent business survey evidence signals a downswing – fourth chart.

We judge that the business investment cycle last bottomed in the second quarter of 2009, implying that the current cycle is already longer than average. Assuming that it does not stretch beyond 10 ½ years – the maximum length in recent decades – another trough could occur by end-2019. This cycle also appears to have peaked in late 2018, judging from recent falls in output / orders of capital goods producers, with declining profits likely to intensify weakness later in 2019.
The cycles analysis, therefore, supports the negative signal for near-term economic prospects from monetary trends, while suggesting a growth bounce-back in 2020, when both cycles may be in new upswings.
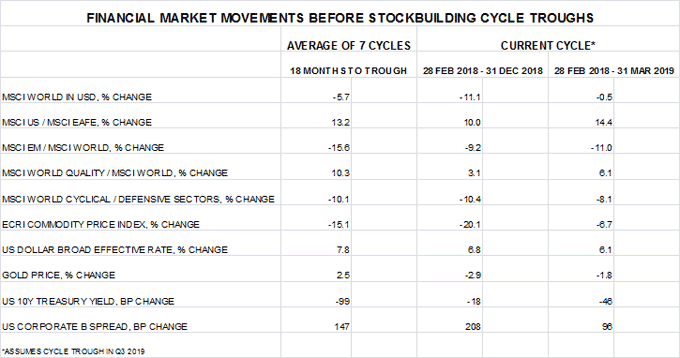
Markets tend to be in “risk-off” mode in the run-up to economic cycle troughs. The table compares the average performance of various assets and long / short pairings in the 18 months leading up to the last seven stockbuilding cycle troughs with returns in the current cycle, assuming that the latter will reach a trough in the third quarter of 2019. As of end-December 2018, current cycle returns were similar to the seven-cycle averages. Equity markets, commodity prices and gold, however, were underperforming the averages, while Treasury and corporate yields were overshooting.

As the final column shows, market moves during the first quarter partially corrected or over-corrected these differences. The end-March deviations from the averages suggest renewed weakness in equities, commodities and corporate credit, a rise in gold and a further decline in Treasury yields over the remainder of the current cycle. In addition, US equities could stop outperforming, emerging equities could underperform and quality stocks could remain in favour.
*The indicators are 1) the difference between the six-month rates of change of G7 plus E7 real narrow money and industrial output and 2) the deviation of the 12-month rate of change of G7-only real narrow money from 3%.
