Entries from March 3, 2019 - March 9, 2019
Negative signals for US business spending
Two recent pieces of news support the expectation here that stockbuilding and business investment will be major drags on the US economy this year.
First, the ratio of inventories to final sales of goods and structures rose further in the fourth quarter, following a large third-quarter gain, according to initial national accounts data released last week. Changes in this ratio are inversely correlated with the future contribution of stockbuilding to GDP growth – see first chart. This relationship suggests a negative GDP contribution of up to 0.5%, or 1.0% at an annualised rate, during the first half of 2019. (This refers to the arithmetical contribution; the total impact would likely be smaller because of offsetting weakness of imports.)

Secondly, sector financial accounts released yesterday reveal a significant further decline last quarter in the liquidity ratio of non-financial corporations, defined as their liquid assets divided by short-term liabilities – second chart. The value of assets was depressed by losses on equity investments, while money holdings – including foreign deposits – grew by only 0.5% over the quarter; liabilities, by contrast, rose by 2.7% (11.1% annualised) as bank borrowing surged, in part reflecting involuntary inventory accumulation.
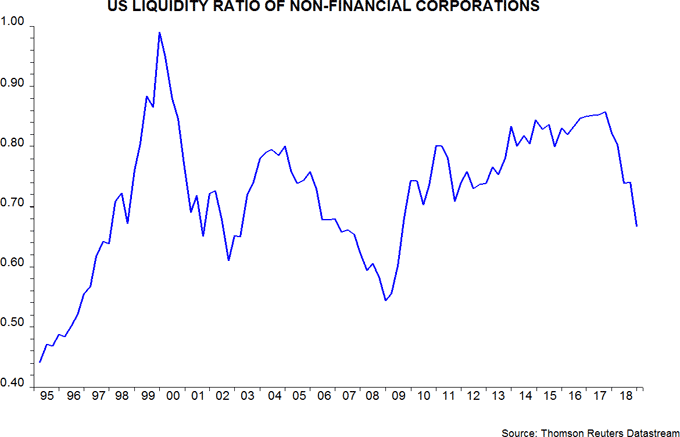
The corporate liquidity ratio fell by 18.9% in the year to end-December. An annual decline of 11% or greater occurred on 11 previous occasions since 1955 and in 10 of these cases non-residential fixed investment contracted on a year-on-year basis in the same quarter or subsequently – third chart. The exception was 1988 but this followed a major investment recession in 1986-87.

Global economy health check: patient still deteriorating
The current global economic downswing is expected here be more severe than the slowdowns in 2011-12 and 2015-16, for two reasons. First, global real narrow money growth fell to a lower level ahead of the current downswing than before the previous two. Secondly, both the stockbuilding and business investment cycles are expected to drag on activity – the prior slowdowns were mainly stocks-driven.
How is this forecast playing out? The first chart shows six-month / two-quarter changes in industrial output and GDP in the G7 economies and seven large emerging economies, with the latest data points referring to December and the fourth quarter respectively. Six-month industrial output momentum fell to 0.7% in December, the lowest since 2016 but well above troughs of -0.2% and -0.7% reached in 2012 and 2015. Two-quarter GDP growth, meanwhile, has also fallen but remains respectable, at 1.5% (3.1% annualised) in the fourth quarter.
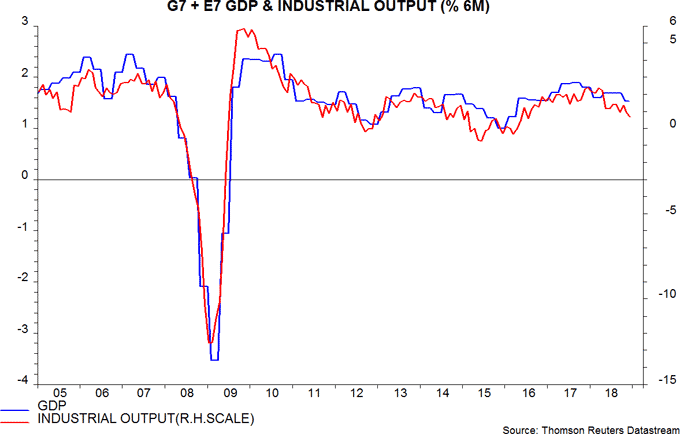
With real money growth bottoming in October, a trough in economic momentum is unlikely to be reached until around mid-2019. Industrial output / GDP data, accordingly, are expected to deteriorate for a further six months, at least.
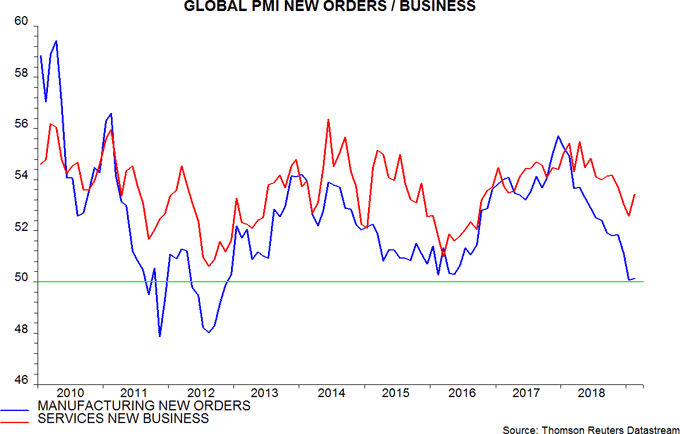
The second chart shows new orders / business components of the global manufacturing and services purchasing managers’ surveys, which supposedly offer a more timely read on economic activity. The final reading of the manufacturing new orders index for February was higher than suggested by earlier flash data but still represents the joint weakest (with January) result since 2012, i.e. undershooting a 2016 low. The services new business index remains solid but a positive divergence with manufacturing is normal in the early downswing phase – similar temporary resilience was displayed in 2012 and 2015.
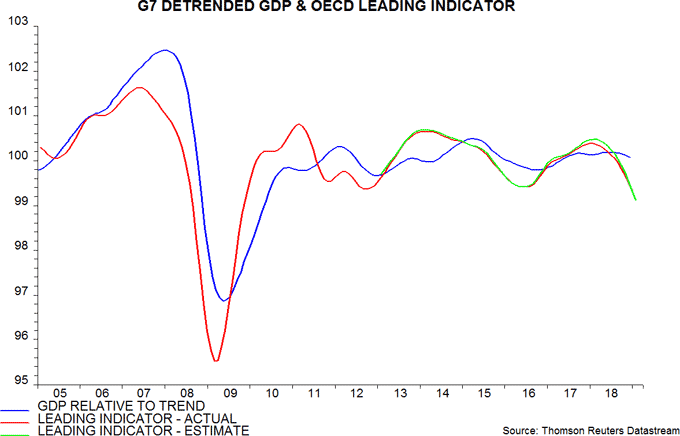
The above series are coincident indicators of economic activity; the OECD’s composite leading indicators are useful for assessing short-term prospects. The third chart shows the deviation of G7 GDP from a statistical trend along with the OECD’s G7 leading indicator, including an estimate for January (official data are released on 11 March). Based on the estimate, the decline in the indicator from a peak in February 2018 is already comparable with the peak-to-trough falls in 2011-12 and 2014-16. A caveat, however, is that the level of the indicator can often be revised significantly, as trends in the individual components are reestimated to incorporate new data. This caveat is less relevant for the direction of the indicator, which has yet to suggest any bottoming out of economic momentum.
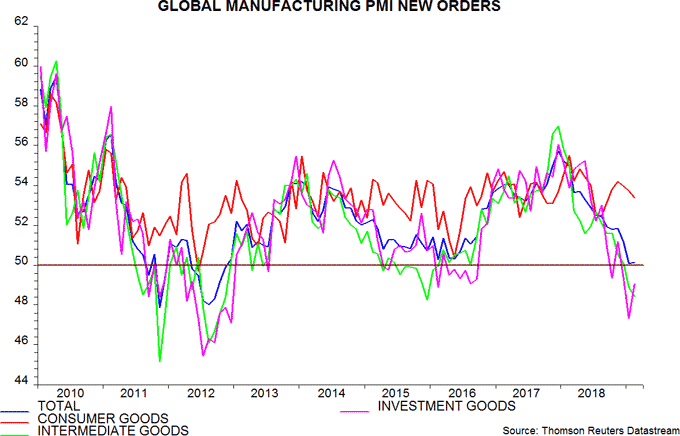
As noted above, business investment is expected here to show greater weakness this year than in 2011-12 and 2015-16. The fall in the global manufacturing PMI new orders index was led by the investment goods component, which moved well below its 2016 low in January, though recovered in February – fourth chart. Recent weakness in intermediate goods orders, meanwhile, is consistent with the stockbuilding cycle moving further into its downswing phase. Consumer goods orders remain solid but – as with services activity – such resilience is not unusual in the early stages of an economic downswing. Consumer weakness typically emerges as slowing activity feeds through to labour markets.
The business investment and profits cycles are closely linked. The fifth chart shows national accounts-based estimates of gross domestic operating profits (EBITDA). Japanese and UK profits contracted in the year to the fourth quarter, while Euroland growth was the weakest since 2013. US fourth-quarter numbers have yet to be released: year-on-year growth is likely to remain solid but the level of profits may have stepped down last quarter, judging from S&P 500 earnings reports.
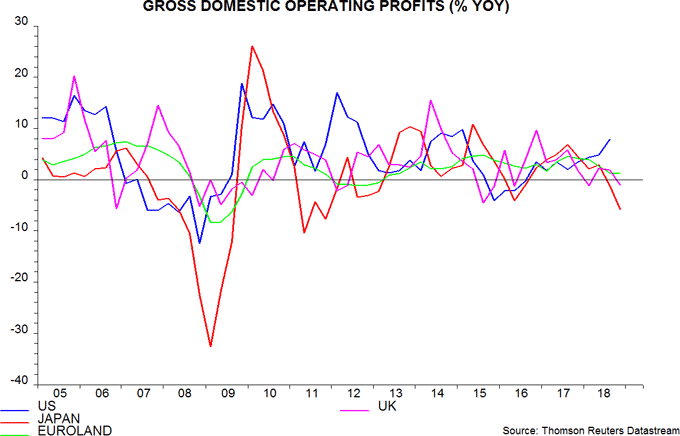
Profits are very likely to remain under pressure during the first half from slowing activity, weak pricing power and rising wage costs due to high settlements and excessive hiring in 2018.
In summary, coincident and short leading evidence has yet to confirm the forecast of a more severe economic downswing than in 2011-12 or 2015-16 but indicators are behaving largely as expected, allowing for the usual leads / lags. If correct, the next phase of economic weakness will involve corporate retrenchment extending from fixed investment and stocks to hiring, undermining consumer confidence and spending and leading to a further deterioration in business sentiment.

