
Entries from February 3, 2019 - February 9, 2019
Negative US monetary revisions
 Simon Ward
 Post a Comment
The Fed yesterday released revised monetary data reflecting the annual benchmarking process and updated seasonal factors. Growth of narrow and broad money in 2018 was revised down significantly – see first and second charts.


The new data, in particular, show a smaller recovery and lower levels of six-month growth at end-2018.
The third chart shows the impact of the revision on global (i.e. G7 plus E7 ) six-month real narrow money growth*. The trough in the series still occurs in October 2018, suggesting a low in six-month industrial output momentum around July. On the previous data, however, growth had risen to a nine-month high in December. The new December reading is no higher than September's.

The new data, therefore, reinforce the negative assessment here of near-term US and global economic prospects while suggesting that weakness will extend into late 2019.
*M1A is used as the US component of this measure. The opportunity was also taken to revise the adjustment made to Indian M1 data to attempt to correct for the impact of demonetisation, with the distortion now assumed to have fully washed out by August 2018.
US loan officer survey signalling credit / economic weakness
The Fed's January senior loan officer survey provides further evidence of a deterioration in US economic prospects, signalling a tightening of loan supply and – more significantly – markedly weak credit demand.
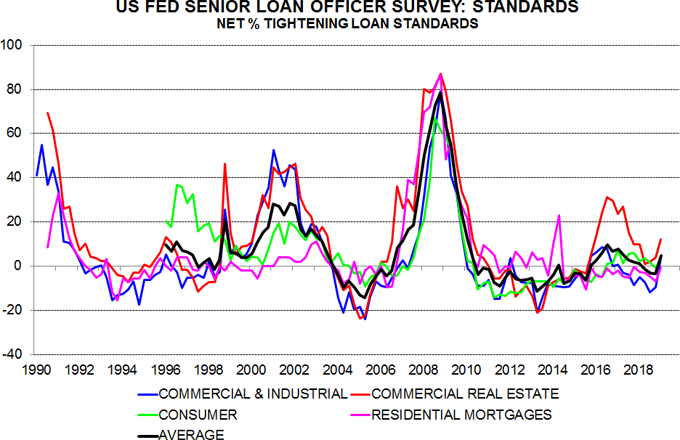
The net percentage of banks tightening lending standards rose across all four major loan categories in the latest three months. An unweighted average of these balances turned positive, reaching the highest level since May 2017 – see first chart.
An average of the balances reporting stronger credit demand, meanwhile, moved deeper into negative territory, reflecting sharply weaker responses for residential mortgages and consumer loans – second chart.
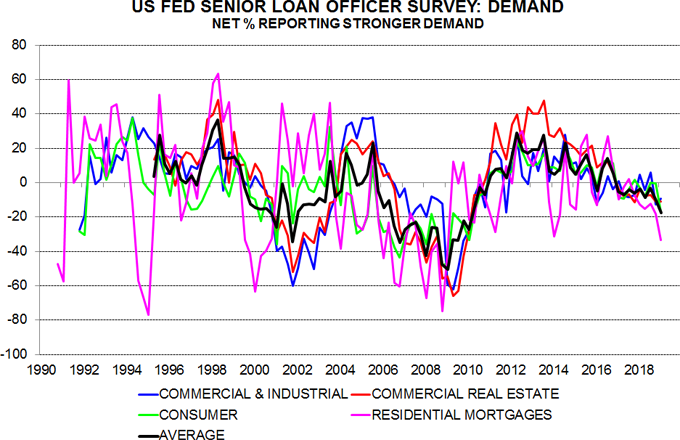
The standards average rose above 20 before the last two recessions, while the demand average fell below -20. The standards measure remains well below the critical level but the demand measure now stands at -18 – third chart.

The January survey included special questions about banks’ outlook for 2019, assuming economic growth in line with the consensus. The responses suggest a further rise in the standards average to 11, with the demand average falling to -19. Banks are expecting additional demand weakness and tightening of standards for C&I and commercial real estate loans but a recovery in housing credit demand, probably reflecting the fall in mortgage rates at end-2018.
The current weakness of the credit demand average suggests that first-half GDP growth will undershoot the consensus forecast – fourth chart. A growth shortfall would probably result in a further ratcheting up of lending standards.

Credit demand indicators also weakened notably in the latest ECB and Bank of England lending surveys, discussed previously here and here.
Global money trends still downbeat
Additional monetary data released last week confirm that global six-month real narrow money growth ticked higher in November / December. Growth, however, remains below its range over 2009-17 – a further sustained increase is needed to warrant a shift away from economic pessimism. January global manufacturing PMI results, meanwhile, are consistent with the forecast here of a joint downturn in the stockbuilding and business investment cycles.
Global (i.e. G7 plus E7) real money growth may have bottomed in October, suggesting that six-month industrial output momentum will slide further to a low around July, allowing for a typical nine-month lead.
Two-thirds of the recovery in global real money growth in November / December reflected a slowdown in inflation, due to weakness in oil and other commodity prices. Nominal money trends have yet to show much improvement – first chart.

The inflation boost could fade towards mid-year, assuming that commodity prices now stabilise – second chart. With economic weakness expected to intensify, however, a further decline in prices is plausible.

The uptick in global real money growth reflects G7 developments, with no revival in the E7 – third chart. The G7 rise has been driven by the US and, to a lesser extent, Euroland – fourth chart.


Stronger US money growth at year-end may prove temporary. Although the Fed capitulated last week, QT is likely to continue at least through mid-year, implying a further contraction in the monetary base (ignoring possible short-term volatility due to changes in the Treasury’s balance at the Fed) – fifth chart.

The expectation here remains that the current global economic downswing will be more severe than the slowdowns in 2011-12 and 2015-16. Global real money trends are weaker now, while cycle analysis suggests that business investment will exert a larger negative influence, adding to a drag from stockbuilding.
Global manufacturing PMI results are moving in line with the forecast. The new orders index fell below the 2016 low in January, with weakness led by investment goods demand – sixth chart.

The survey, meanwhile, confirms a downswing in the stockbuilding cycle: the annual change in the sum of the inventory indices for finished goods and purchased inputs turned significantly negative in January – seventh chart.

