
Entries from January 27, 2019 - February 2, 2019
UK money trends: continued weakness
 Simon Ward
 Post a Comment
UK money trends, while not deteriorating further, continue to suggest a weak economic outlook. GDP growth may fall below 1% this year even if a no-deal Brexit is avoided.
Six-month growth rates of real narrow and broad money (non-financial M1 / M4) were little changed in December and remain low by historical and international standards – see first chart.

Real money growth, as in Euroland, has been supported by a fall in inflation. In addition, Brexit and other risks may have boosted the precautionary demand for money, in which case current money growth rates may overstate near-term prospects for spending on goods and services.
Consistent with the latter story, retail investors sold mutual funds in the fourth quarter of 2018 for the first time since the EU referendum quarter in 2016 (and on a larger scale than then)*. Bank of England commentary, meanwhile, notes an above-average rise in household M4 holdings in December, driven by deposits in interest-bearing instant access savings accounts. A savings measure combining M4 holdings, mutual funds, National Savings and foreign currency deposits (“non-financial M4++”) is growing more weakly than the money aggregates – second chart.

Broad money trends have been supported from the credit side by steady expansion of bank and building society lending to the private sector. The latest Bank of England credit conditions survey, however, suggests a coming lending slowdown – third chart.

The OECD’s UK composite leading indicator continues to give a gloomy message for economic prospects, falling further in December – fourth chart**. The indicator is designed to predict the direction of GDP relative to trend, i.e. a decline signals below-trend growth, with trend currently estimated at 2.0% per annum. Four of the six components exerted a negative influence in December – consumer confidence, local share prices, expected services demand and interest rates***.

The above developments argue for the Monetary Policy Committee to shift to an easing bias at its upcoming meeting, although such a move appears unlikely.
*Source: Investment Association.
**Estimate based on data for five of six components. OECD data released on 11 February.
***The other components are car sales and expected manufacturing output.
Euroland money trends: false positive?
Recent Euroland money / credit news has been a mixed bag. The assessment here is that economic momentum is likely to remain weak but a region-wide recession will be avoided barring an external shock.
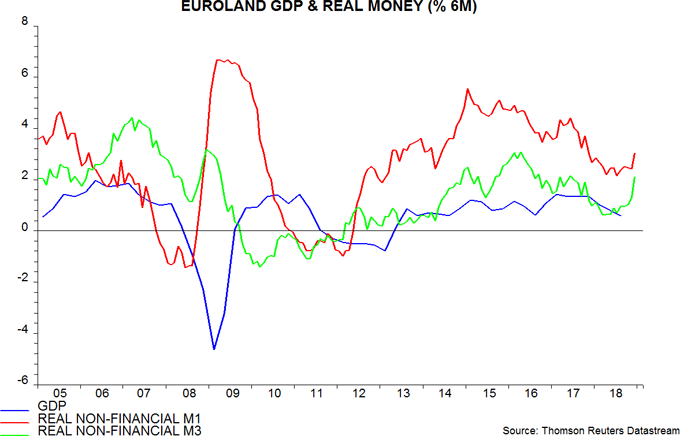
December money numbers released yesterday were, on the face of it, positive. Six-month growth rates of real narrow and broad money (i.e. non-financial M1 and non-financial M3*) rose notably, in the latter case to an 18-month high – see first chart. Allowing for a typical nine-month lead, the suggestion is that GDP growth will rebound in the second half of 2019.
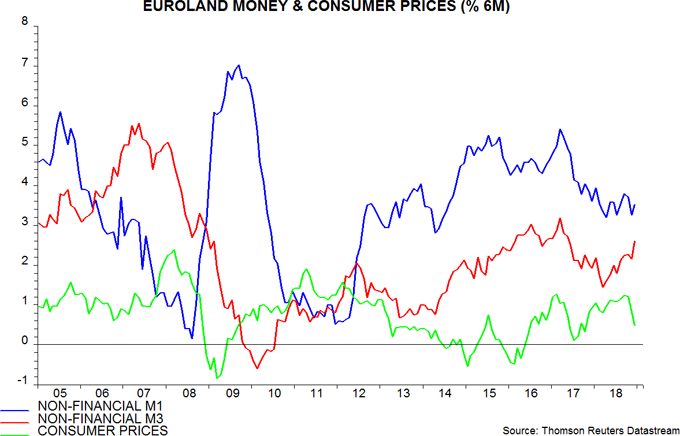
There are, however, grounds for caution. Stronger real narrow money growth has been driven by a slowdown in inflation, reflecting pass-through of weaker energy and food commodity prices, with nominal money trends stable – second chart. Inflation is likely to recover unless commodity prices weaken further, so real money growth could fall back.
The stronger performance of broad money, which has accelerated in nominal as well as real terms, could be argued to warrant optimism. Narrow money, however, has outperformed broad money as a leading indicator historically. Real broad money growth rose in 2010 and 2015 without a corresponding pick-up in narrow money; the economy subsequently slowed – first chart.
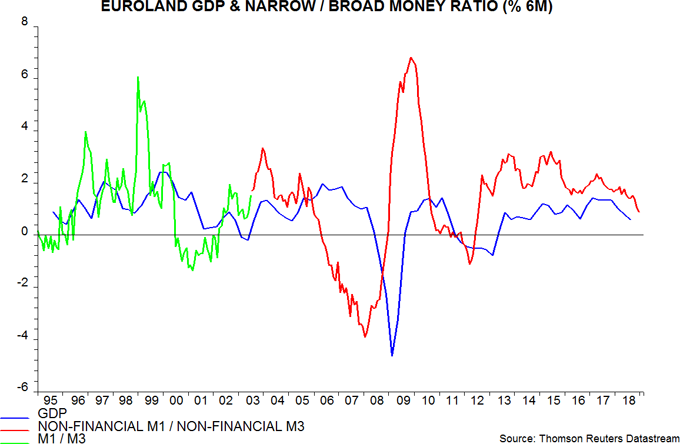
The ratio of narrow to broad money, indeed, has itself been a reasonable leading indicator of activity historically; this ratio continues to slow – third chart.
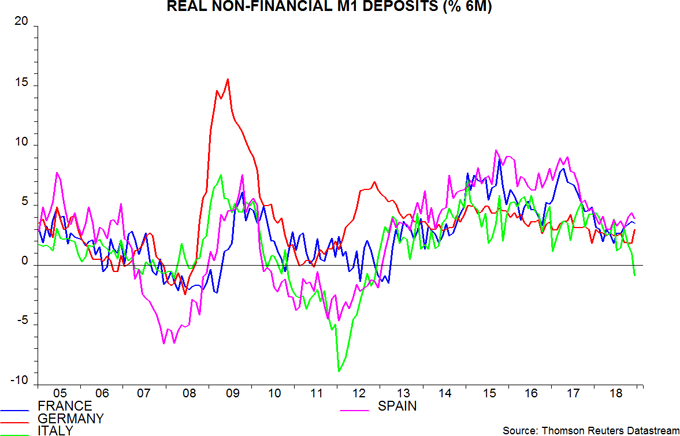
A further reason for caution is that narrow money trends may be starting to diverge across economies. Italian real non-financial overnight deposits contracted in the six months to December – fourth chart. A core / periphery divergence opened up before the 2009-10 and 2011-12 recessions. Euroland-wide GDP reacceleration is unlikely if the Italian economy is moving into recession.
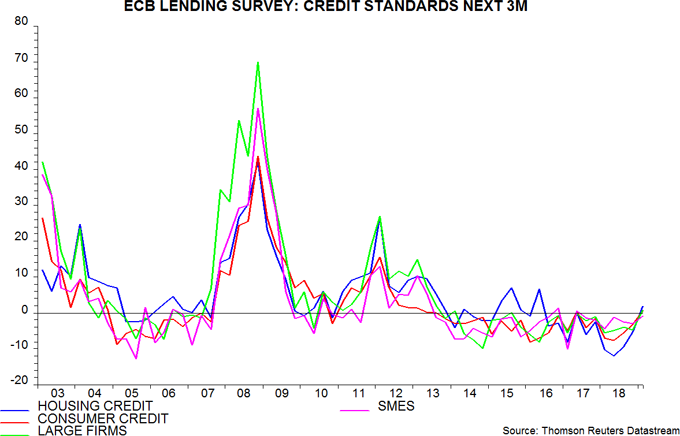
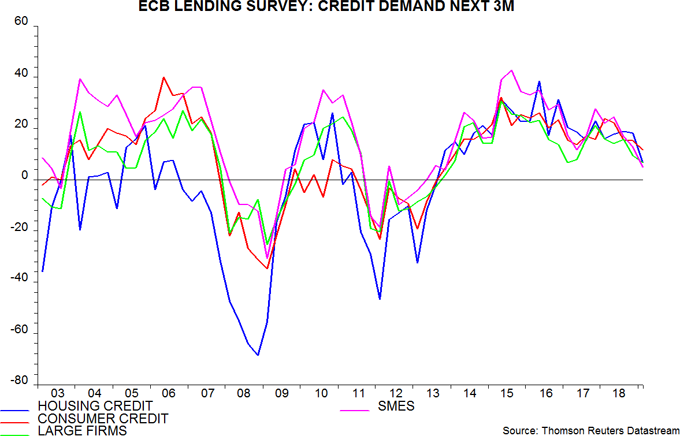
The ECB's fourth-quarter bank lending survey released last week, meanwhile, indicated less favourable expected trends in credit supply and demand – fifth and sixth charts. A slowdown in private sector lending could dampen broad money growth.
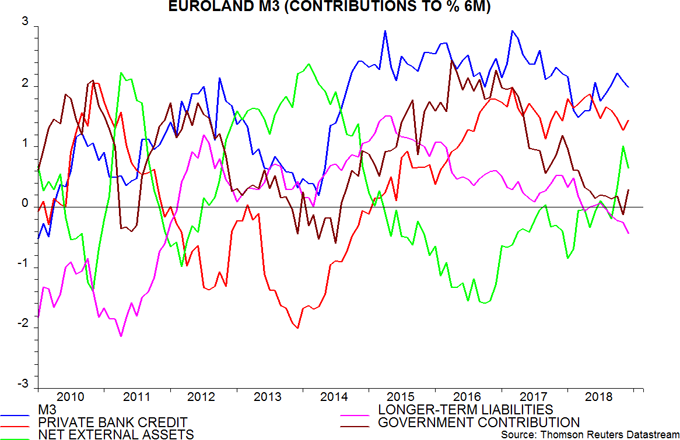
An interesting question for monetary anoraks is why broad money growth has picked up despite slowing QE. The counterparts analysis of the headline M3 measure shows that a fall in the government contribution to money growth, which incorporates the QE effect, has been more than offset by a shift from contraction to expansion in the banking system’s net external assets – seventh chart.
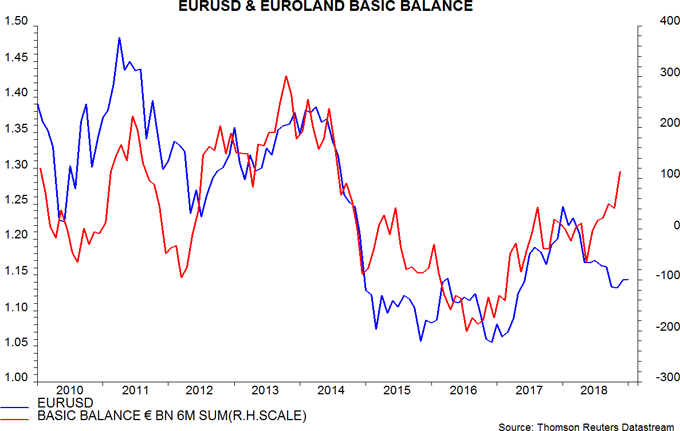
The interpretation here is that QE boosted domestic credit expansion but had little impact on broad money because “excess” liquidity was exported through the non-bank capital account of the balance of payments – the contraction of banks’ net external assets was the mirror-image of this capital outflow. With QE slowing, the outflow fell in the second half of 2018 and was smaller than the current account surplus, resulting in banks’ external position contributing positively to monetary growth. The stronger “basic” balance of payments position, i.e. current account plus non-bank capital account, could support the euro – eighth chart.
*Money holdings of financial institutions are excluded because they are volatile and unlikely to be relevant for assessing near-term prospects for spending on goods and services.
