Entries from December 9, 2018 - December 15, 2018
Euroland PMIs: stabilisation ahead?
A post in February suggested that the Euroland manufacturing PMI, then still strong at 58-59, would fall towards the 50 level by mid-2018. The decline has taken longer than expected but the PMI eased further to 51.4 in December (with assistance from the gilets jaunes). The composite manufacturing / services output index slid to 51.3, a four-year low. What now?
The basis for the February forecast was a significant fall in six-month real narrow money growth from June 2017 and an expectation that this would be reflected in PMI results with a lag of about six months. The chart, an update from the February post, illustrates this relationship, which now suggests that the PMI will stabilise around the 50 level through April 2019, based on monetary data through October 2018*.

Current money trends are judged here to be consistent with GDP growing by about 0.3% per quarter in the first half of 2019 – see previous post. Surprisingly, the new ECB staff forecast released yesterday maintained the previous central projection of 0.5% per quarter despite recent negative news. The suspicion is that a downgrade was postponed to avoid calling into question the decision to end QE. (Even more remarkably, the forecast commentary made no mention of the risk of a disruptive / disorderly Brexit.)
It should be emphasised that money trends – broad as well as narrow – are not signalling economic stagnation or contraction. The six-month change in real narrow money turned negative ahead of the 2008-09 and 2011-12 recessions. It stood at 2.4% in October.
The manufacturing PMI would need to fall to around 45 to suggest a GDP recession.
It has been claimed that the cessation of QE will lead to a “mechanical” further slowdown in money growth. Cross-country evidence, however, shows that the relationship between QE and money trends has been weak. Euroland money trends were improving well before QE started in 2015, probably reflecting rate cuts and expanded ECB lending to banks. Proponents of a “mechanical” relationship wrongly suggested that Japanese broad money growth would soar following the expansion of QE in 2013 – it barely budged.
The view of economic prospects here remains on the pessimistic side of the consensus but money trends do not currently warrant a further downgrade. Relative money trends suggest that downside risks are now greater in the US and China.
*The chart uses the EU Commission manufacturing survey as a proxy for the PMI before 2016 because of lack of access to historical data.
Chinese money trends still weak, dashing reflation hope
Chinese November money and credit numbers were disappointing for economic optimists, suggesting that policy easing is still failing to gain traction.
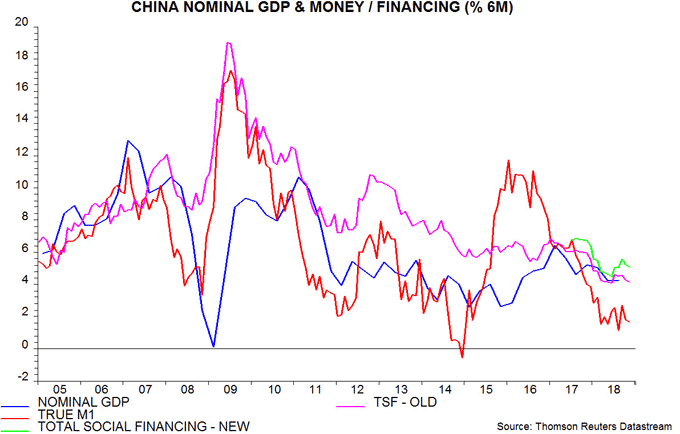
Six-month growth of true M1, the preferred narrow money measure here, was little changed in November and close to the recent low reached in August – see first chart*.

Six-month growth of total social financing, on the new definition including local government special bonds, similarly showed no improvement. The recovery from a low in June solely reflects heavy issuance of such bonds over July-September. On the former definition, six-month expansion in November almost matched the recent low.
Year-on-year growth of all three measures reached new lows in November – second chart.

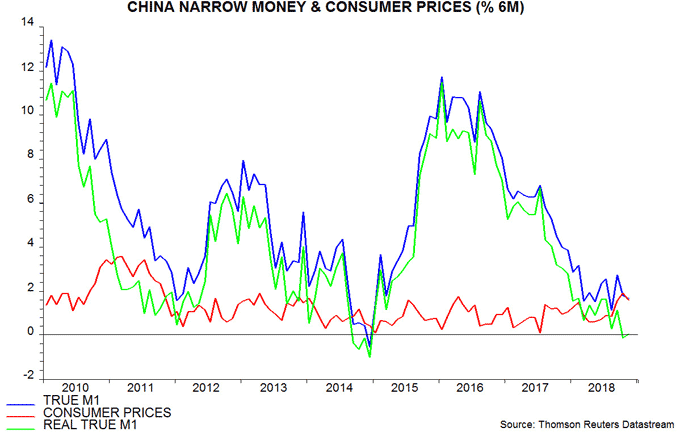
As expected, real money and credit growth in November was supported by a fall in consumer price inflation, reflecting declines in fuel and food prices. The six-month change in real true M1, however, remained close to zero – third chart.

Sectoral figures show that year-on-year growth of bank deposits of non-financial enterprises fell further in November and is now lower than before the 2015-16 economic slowdown / hard landing scare. Weakness is consistent with recent profits deceleration and signals deteriorating prospects for business investment – fourth chart.

The year-on-year fall in interest rates suggests a coming recovery in money trends – fifth chart – but this may be delayed and / or weakened by the ongoing clampdown on shadow banking activity. The authorities may need to offer banks additional incentives to lend to private sector firms to offset the contraction of shadow activity. Current money data signal a further loss of economic momentum in early 2019, with any reacceleration unlikely until the second half at the earliest.

*True M1 = currency in circulation + demand deposits of enterprises, government organisations and households. The official M1 measure excludes household deposits. The November data point in the chart is an estimate and assumes a 1% monthly rise in household demand deposits.
US money weakness extending to household sector
US narrow money trends remain worryingly weak, suggesting that monetary policy is already restrictive and a significant economic slowdown lies immediately ahead.
The Fed last week released sector financial accounts for the third quarter, permitting the calculation of an end-September number for non-financial M1, the preferred narrow money measure here*. The two-quarter change in real (i.e. deflated by consumer prices) non-financial M1 moved into negative territory, reaching its lowest level since 2008. The leading relationship with two-quarter GDP momentum suggests that the latter will fall sharply from a third-quarter peak – see first chart.

Narrow money trends appear to have remained weak so far in the fourth quarter, judging from the headline M1 measure – the chart incorporates a November estimate of the six-month change in real M1 based on weekly data through 26 November.
The weakness of real non-financial M1 was initially focused on the business sector but household holdings also contracted over the latest two quarters – second chart. Previous posts suggested that the fall in business holdings would be reflected in a slowdown in investment and hiring – recent data (e.g. capital goods orders, aggregate hours worked) lend support to this forecast. With household holdings also now weakening, consumer spending could be next to disappoint.

The fall in business money holdings, which extends to the broad M3 measure, has occurred despite foreign earnings repatriation, which might have been expected to swell domestically-held corporate deposits. The financial accounts show that the repatriation flow has been offset by a rise in net equity retirement (i.e. buy-backs and cash takeovers), a slowdown in debt issuance and faster accumulation of “miscellaneous assets”. The flow peaked in the first quarter and fell further in the third quarter, with a corresponding slowdown in net equity retirement – third chart.

The negative signal for economic prospects from money trends is receiving confirmation from the OECD’s US composite leading indicator. As previewed in a post last week, this indicator continued to decline in October, signalling below-trend GDP growth – fourth chart.

*Non-financial M1 comprises holdings of currency and checkable deposits by households and non-financial businesses. Headline M1 also includes holdings of insurance companies, pension / retirement funds, money market funds, government-sponsored enterprises, finance companies, REITs, brokers / dealers and foreign non-banks (excluding official institutions). These holdings account for more than 30% of M1 (dominated by the foreign component, mainly currency) but are unlikely to be of relevance for assessing near-term prospects for spending on goods and services.

