
Entries from October 21, 2018 - October 27, 2018
Profits taking strain of rising wage growth
 Simon Ward
 Post a Comment
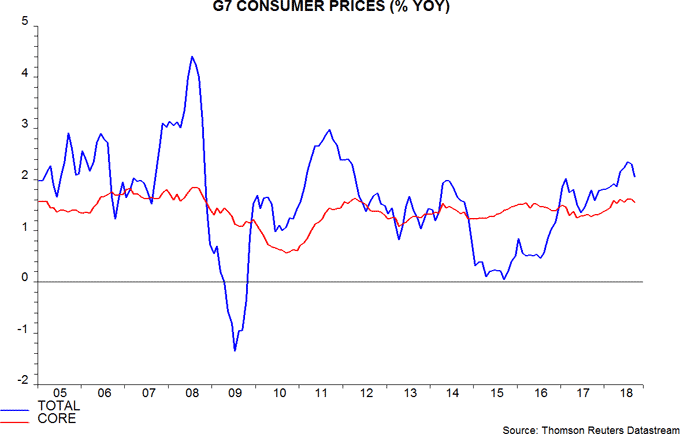
Recent inflation news is consistent with the view here that rising wage cost growth is having a greater impact on profit margins than core price trends.
G7 headline and core (i.e. ex. food / energy and large tax changes) consumer price inflation eased for a second month in September. The core rate remains near the top of its post-crisis range but the recent July peak only matched a 2012 high, when labour markets and wage pressures were much weaker – see first chart.
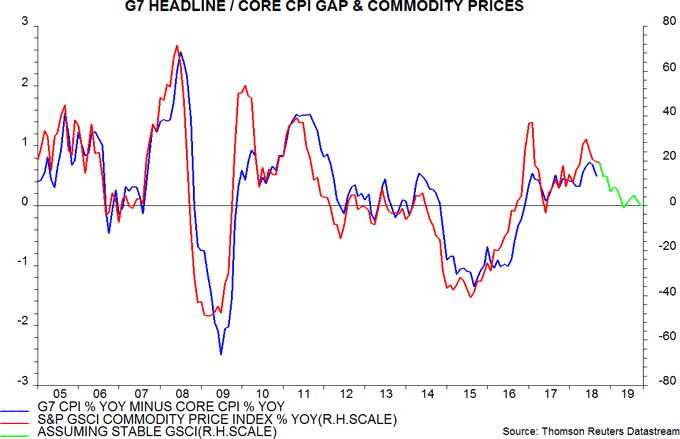
The headline / core gap probably peaked in July and is likely to fall further into early 2019, assuming that commodity prices remain at their current level – second chart.
The judgement here has been that firms would struggle to push through price increases against a backdrop of restrictive monetary conditions and slowing economic momentum.
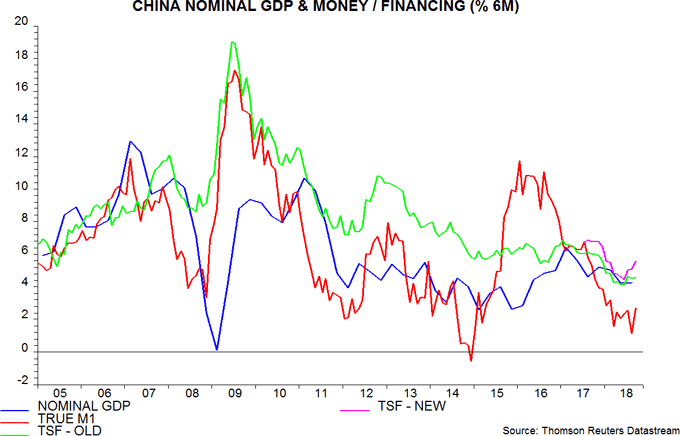
The third chart compares annual growth rates of nominal GDP and narrow money for the G7 plus E7 grouping. Nominal GDP expansion probably peaked in the second quarter of 2018, the latest data point, with money trends signalling a sustained slowdown. Assuming stable or more likely rising wage growth, lower expansion of aggregate nominal income implies a slowdown or outright weakness in profits and / or employment. Profits should take the strain first, leading to subsequent employment cut-backs.

Euroland slowdown on track but money trends stable
Euroland narrow money trends signalled the current economic slowdown and now suggest that momentum will stabilise at a weak level in early 2019.
Six-month growth of real narrow money, as measured by non-financial M1 deflated by consumer prices, peaked in June 2017 and fell sharply through April 2018, reaching a five-year low. Allowing for a typical nine-month lead, this suggested that two-quarter GDP growth would top out in early 2018 and decline through year-end.
The slowdown, in the event, started slightly earlier, possibly reflecting euro strength during 2017. Two-quarter GDP expansion fell from 1.3% in the fourth quarter of 2017 to 1.1% in the first quarter of 2018 and 0.8% in the second quarter – see first chart.

Purchasing managers’ surveys signal a further loss of momentum since mid-year. The October flash reading of the composite output index is consistent, according to the survey compiler, with GDP expansion of only 0.3% per quarter.
Money trends, however, have stabilised since early 2018, with six-month real narrow money growth slightly higher in September than at end-2017. Real broad money – non-financial M3 – expansion has also edged up.
This may prove to be a pause before further deterioration but the implication is that GDP momentum will stabilise at a weak level in early 2019, in which case purchasing managers’ indices may find a bottom soon, although a recovery is unlikely.
The expectation here remains for GDP to rise by 0.25-0.35% per quarter, below the September ECB staff central forecast of quarterly growth of 0.4% in the second half of 2018, rising to 0.5% during 2019 – such a reacceleration now seems wildly unrealistic.
The Italian fiscal crisis and associated rise in the sovereign yield spread have yet to be reflected in any relative weakness of Italian money trends. Six-month growth of real non-financial M1 deposits was similar across the big four economies in September – second chart.

Chinese money trends stabilising, outlook still weak
Chinese money and credit trends appear to be starting to respond to policy easing but a further recovery is needed to warrant shifting away from a negative view of economic prospects.
GDP and other activity data released last week confirm that the economy continued to lose momentum during the third quarter. Six-month growth of narrow money*, however, rebounded last month, reaching its highest level since February – see first chart.
Total social financing (TSF) also accelerated, reflecting heavy issuance of local government special bonds, used to finance investment – such bonds were added to the TSF definition this month, with data backdated to January 2017. TSF growth on the former definition remained soft in September, probably partly reflecting local government issuance “crowding out” other financing – first chart.
The apparent bottoming out of money / credit growth suggests a future stabilisation of economic momentum but there is no signal yet of a meaningful rebound. Even if money trends continue to improve, economic growth is unlikely to revive before the second quarter of 2019 at the earliest.
Experience in 2015-16 is cautionary: six-month growth of narrow money was at a similar level in April 2015 and subsequently surged into double-digits (not annualised) but a significant pick-up in two-quarter nominal GDP expansion was delayed until the second quarter of 2016 – first chart.
Increased local government issuance / spending has contributed to a recovery in public sector fixed asset investment, the annual change of which turned positive in September – second chart. Further strength, however, could be offset by a slowdown in housing investment: housing floor space sold was down last month from a year ago, while starts lost momentum – third chart.


Recent and prospective increases in US import tariffs are an additional headwind, while the extent of a rebound in money growth remains unclear, with the authorities still reluctant to sanction full reopening of the credit taps. Such action, moreover, could result in a further increase in capital outflows, dampening the monetary impact and adding to downward pressure on the currency. The forward discount on the offshore yuan suggests that outflows have remained elevated so far in October – fourth chart.

An optimistic view is that significant income tax cuts implemented this month and further reliefs announced over the weekend to take effect in January 2019 will boost consumer spending growth; an acceleration of household demand deposits from October would lend support to this scenario.
Other leading indicators suggest near-term further economic weakness. A composite leading indicator proposed in a previous post as an alternative to the OECD’s measure continued to fall in September, signalling below-trend economic expansion – fifth chart.

*True M1 = official M1 plus household demand deposits. Official M1 = currency in circulation plus corporate demand deposits.
