
Entries from September 16, 2018 - September 22, 2018
US corporate money slowing - business investment to disappoint?
 Simon Ward
 Post a Comment
US second-quarter financial accounts released yesterday provide additional information about recent monetary trends. Business money trends have weakened significantly despite tax cuts and foreign profits repatriation, supporting the forecast of an economic slowdown through early 2019.
The monetary forecasting approach employed here places particular emphasis on the narrow non-financial M1 measure, comprising holdings of currency and checkable deposits by households and non-financial businesses. The headline M1 aggregate also includes holdings of insurance companies, pension / retirement funds, money market funds, government-sponsored enterprises, finance companies, REITs, brokers / dealers and foreign non-banks (excluding official institutions). These holdings account for more than 30% of M1 (dominated by the foreign component, mainly currency) but are unlikely to be of relevance for assessing near-term prospects for spending on goods and services.
Most major countries provide a monthly sectoral breakdown of monetary data. In the US, unfortunately, non-financial M1 is available only quarterly with a reporting lag of over two months.
The first chart compares two-quarter / six-month changes in GDP, real M1 and real non-financial M1. Fluctuations in real narrow money momentum have generally led swings in GDP growth in recent years, with non-financial M1 outperforming M1.

Both real money measures lost momentum during 2017 but there was a divergence in early 2018, with headline M1 remaining weak but non-financial M1 rebounding. This rebound was consistent with the expected impact of tax cuts and has been reflected in recent / current strong economic data.
The financial accounts show that M1 was dragged down around end-2017 by falls in money holdings of money market funds, GSEs and REITs.
The divergence between the two measures, however, closed in the second quarter, with the two-quarter change in real non-financial M1 falling back sharply. Both real M1 and real non-financial M1 barely grew between December and June. Two-quarter GDP growth is likely to have peaked in the second quarter and may fall significantly into early 2019.
The weakness in non-financial M1 has been driven by the business component: real M1 holdings of non-financial businesses contracted by 5.3% between December and June – second chart. Corporations, which account for nearly 80% of non-financial business M1, were responsible for the decline, with holdings of unincorporated businesses rising.

Business broad as well as narrow money trends have weakened. M3 holdings of non-financial businesses rose by only 0.2% in nominal terms in the year to end-June, while M1 contracted by 2.8% – third chart.

Why hasn’t business liquidity benefited from post-tax profits strength and foreign earnings repatriation? The financial accounts show that non-financial corporations repatriated $52 billion of foreign profits in the second quarter after $173 billion in the first quarter. This inflow, however, was used to finance increased share buy-backs and cash take-overs: net retirement of equities rose to $101 billion in the first quarter and $210 billion in the second quarter – fourth chart. Corporations have also slowed bond issuance this year.

The distribution of money by corporations casts doubt on hopes of an internally-financed boom in business investment. The corporate flow has supported money growth of households but pass-through to consumer spending may be small.
UK inflation resilience consistent with past monetary strength
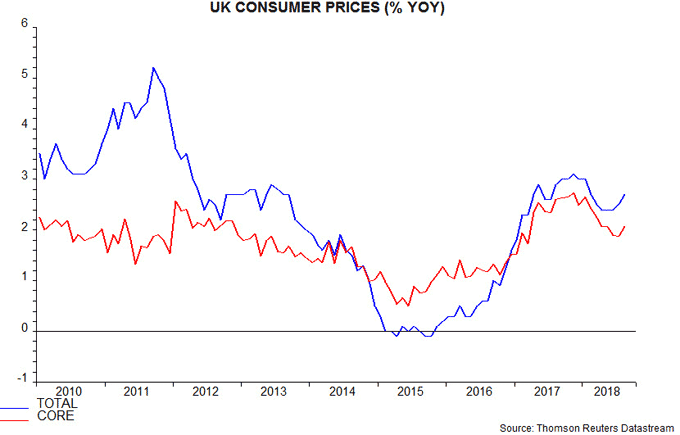
UK consumer price inflation rebounded to 2.7% in August, well above a consensus estimate of 2.4% and suggesting an overshoot of the 2.48% forecast for the third quarter in the August Inflation Report. Core as well as headline inflation pushed higher – see first chart*. Hikes in household energy bills may contribute to the headline rate remaining at around 2.5% in the fourth quarter, rather than falling to 2.29%, as predicted in the Report.
Does this news vindicate the MPC’s August rate hike and even suggest a need for further near-term policy tightening?
Not according to the analysis here. Inflation resilience is judged to be a reflection of monetary strength in 2016, taking into account the historical two-year-plus lead from monetary trends to core retail / consumer prices, documented in a post in May 2016. Annual growth rates of broad and narrow money – as measured by non-financial M4 / M1 – peaked in September 2016, falling to the lowest levels since 2011-12 in the second quarter of 2018. Inflation, therefore, should subside in 2019-20, barring significant sterling weakness or a commodity price shock.
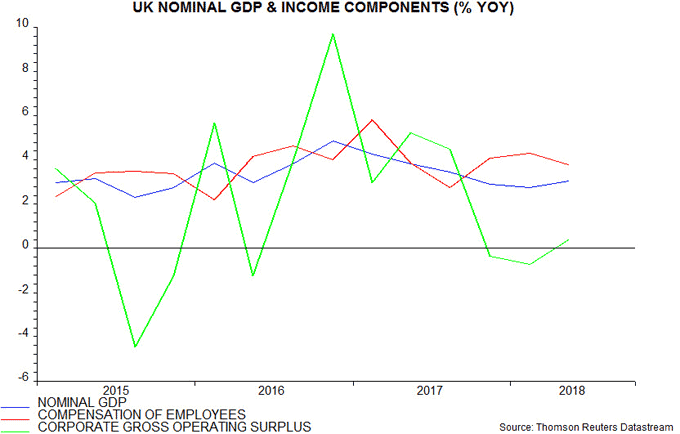
MPC hawks are concerned about upward pressure on earnings and unit labour cost growth but profit margins rather than prices are likely to take the strain against a backdrop of restrictive monetary conditions and weak economic expansion. A margin squeeze, indeed, is already under way: annual growth of employee compensation has been above that of nominal GDP over the last three quarters, resulting in corporate gross operating profits stagnating – second chart.
Monetary trends need to strengthen to justify further policy tightening. As previously discussed, the numbers through July were showing signs of recovery but this may have been aborted by the August rate hike – the next data release is on 1 October. The August inflation jump, meanwhile, will act as a drag on real money growth and, by extension, economic prospects.
*Core = excluding energy, food, alcohol, tobacco and education, and adjusted for VAT changes.
Chinese money trends still weakening - policy easing too little / late?
Chinese August money numbers were surprisingly weak, suggesting that the economy will continue to lose momentum into early 2019, despite a recent shift towards policy easing.
Annual growth of narrow money – as measured by true M1* – fell to 4.3% in August and is approaching levels reached in late 2014 / early 2015, ahead of the 2015-16 hard landing scare. Nominal GDP expansion has been following narrow money growth lower and may weaken significantly further by early 2019 – see first chart.

Shorter-term money growth rates also eased: six-month expansion fell to 1.1%, or 2.3% at an annualised rate, again the lowest since 2015. Real-terms growth – relative to consumer prices – is approaching zero.
Recent falls in interest rates suggest a revival in money trends but the timing and magnitude are uncertain – second chart. Even if growth were to pick up from September, a recovery in economic momentum would be unlikely before spring 2019.

Historically, monetary policy loosenings have involved relaxation of quantitative controls on credit creation as well as lower rates. The clampdown on shadow banking activity, however, continues, with weakness in this sector offsetting a recent slightly faster pace of bank lending growth: annual expansion of total social financing fell further to 9.5%** in August, a record low in data extending back to 2004.
Without accompanying credit loosening, PBoC liquidity injections and lower rates may have a delayed and muted impact on monetary trends and, by extension, economic activity.
The narrow money slowdown has been broadly based across its components – currency in circulation and corporate / household demand deposits. Deposit growth of non-financial enterprise is particularly weak – only an annual 0.4% in August.
Annual growth of broad money has been stable in recent months but at a weak level by historical standards. Headline M2 expansion has been supported by a rapid rise in financial sector deposits; the non-financial M2 measure preferred here rose by only 7.3% year-on-year in August – third chart.

Optimists expect infrastructure spending to boost the economy later in 2018 but state-led fixed asset investment continued to fall year-on-year in August – fourth chart. Private investment growth remained solid but slowing enterprise money trends suggest weakening prospects.

Housing activity has been stronger than expected here so far in 2018 but annual sales growth fell back in August and may be signalling a peak in price inflation – fifth chart. Recent rapid price gains have probably contributed to the authorities’ reluctance to lift credit restraints.

The monetary signal of a further economic slowdown is supported by the latest reading of an alternative composite leading indicator discussed in a previous post. To recap, the OECD’s composite leading indicator may no longer be reliable given structural shifts in the Chinese economy. The alternative indicator attempts to replicate the components of the OECD’s US leading indicator, with the aim of achieving broader economic coverage. The alternative indicator moved sideways in 2017 / early 2018 but has fallen significantly since March, suggesting below-trend economic expansion – sixth chart.

Five of the six components of the alternative leading indicator have weakened recently, the exception being the slope of the yield curve. The latest reading was dragged down by weakness in domestic orders and future income confidence in the PBoC’s third-quarter business and consumer surveys respectively, released over the weekend.
*True M1 = official M1 plus household demand deposits. Official M1 = currency in circulation plus demand deposits of non-financial enterprises and government organisations.
**Old basis. 10.1% on new basis including asset-backed securities and loan write-offs. New basis unavailable before 2017.
